Performance Issues
Learn more about which performance issues Sentry detects and how to use the Issue Details page to debug them.
A performance issue is a grouping of transaction events that are performing poorly. If your application is configured for Insights and Tracing, Sentry will detect common performance problems, and group them into issues. We group similar transaction events into issues based on a fingerprint. For performance issues, a fingerprint is primarily based on the problem type and the spans involved in the problem.
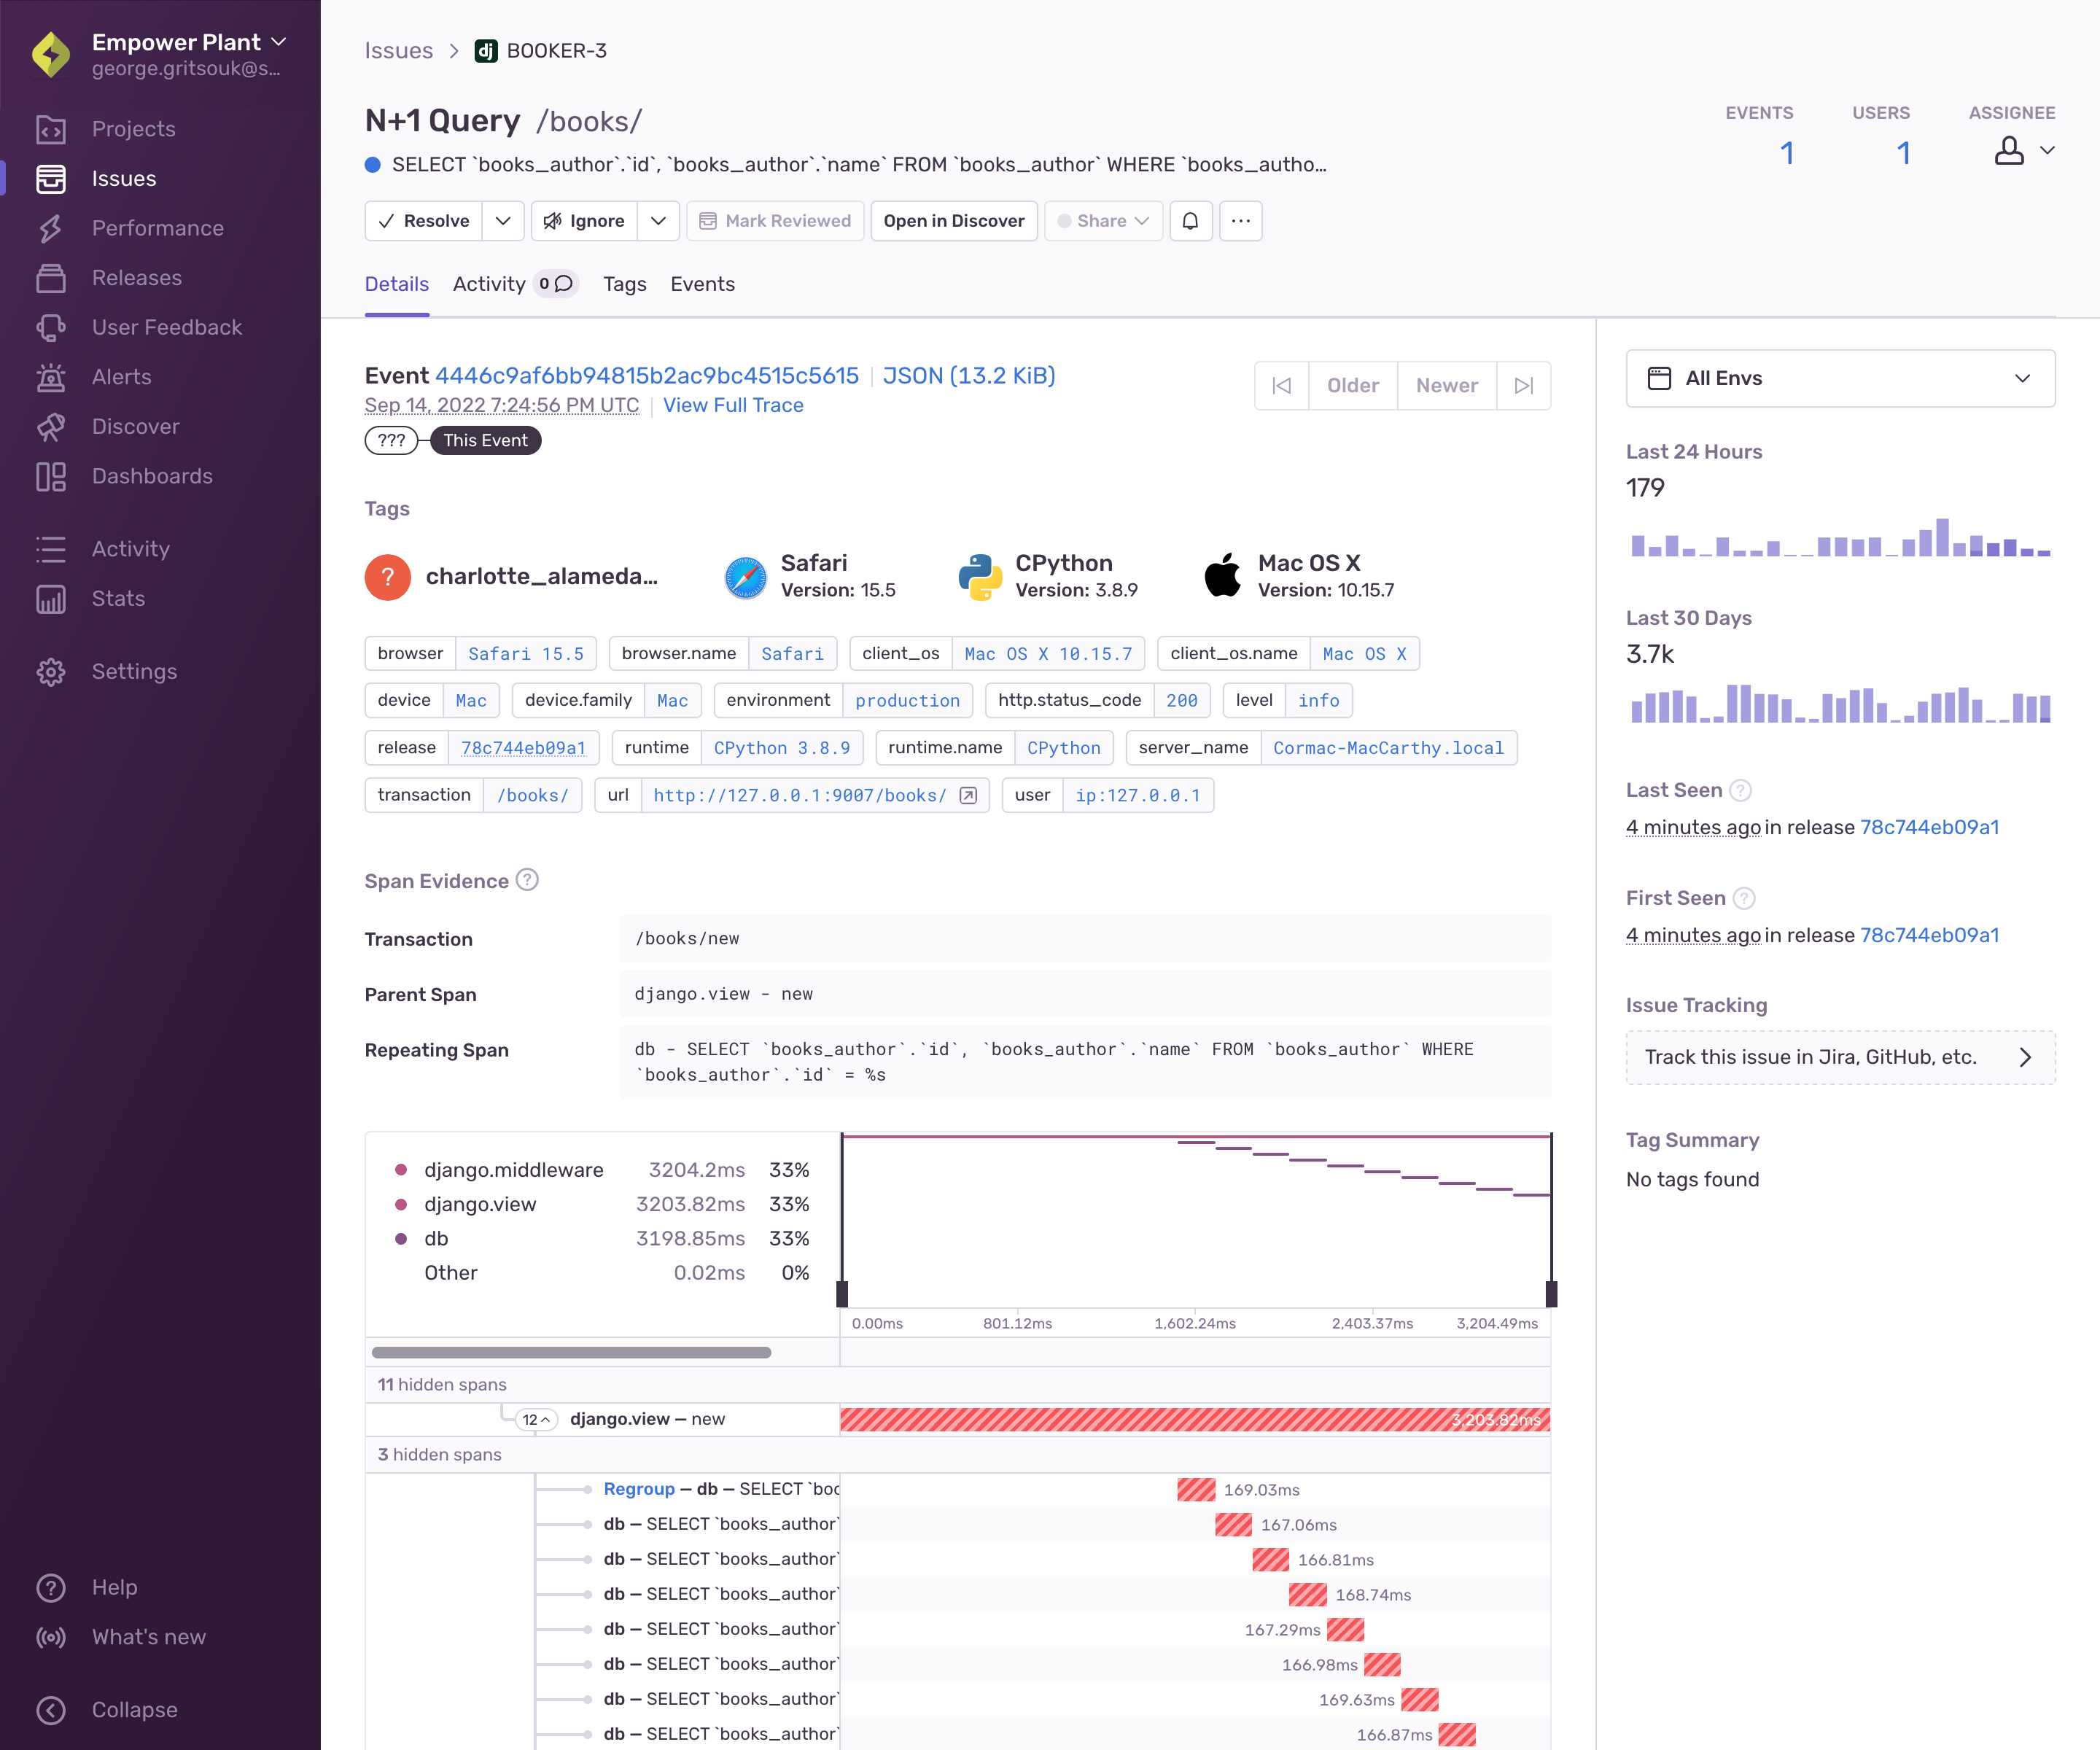
The Issue Details page helps you to gain further insight into the source of a performance issue and the impact it has on your application's users. The main area of the page displays information about a specific transaction event that's part of an issue. The top panel and right-hand sidebar of the page display a summary of all the transaction events grouped together in this issue:
You can find performance issues by searching issue.category:performance in Issues and Dashboards.
While the Issue Details page displays information about a specific transaction event that's part of an issue, you can navigate between the events of an issue using the "Older" and "Newer" buttons. On this page, you'll see information about the performance issue as well as the details of the most recent transaction event. The page also displays a summary of when the issue was seen, as well as a breakdown of the tags, span evidence, and breadcrumbs if they are available.
Sentry detects performance issues by scanning incoming transaction events. First we check various properties of the transaction (span durations, span arrangement, span types, and so on) to detect likely problems. We then check these properties against corresponding thresholds to determine whether a performance issue exists. Lastly, we generate a unique problem fingerprint based on the problem type and location in the application, and use that fingerprint to create a performance issue.
Span evidence is information that explains the performance problem in the context of the current event. It may include details like the specific database queries that cause the problem, the spans that contain the problem, and the slow spans that have an impact on performance. This section also has a span tree which shows how the problematic spans relate to the rest of the event. Different performance problems will have slightly different kinds of evidence.
The "Event Grouping Information" section provides details of how Sentry fingerprinted the event into the group. You can see which parts of the span evidence contributed to the fingerprint.
As a Project Admin, you can also manage individual settings for each performance issue detector in Project Settings > Performance. Here, you can raise or lower the thresholds for what Sentry considers a performance issue for each project, or disable detection altogether.
The following is a list of available performance issues:
| Browser | |
|---|---|
| Server | |
| Mobile | |
| Serverless |
Performance issues currently have the following limitations:
- Performance issues cannot be merged
- Custom fingerprinting and grouping can't be applied to performance issues
Our documentation is open source and available on GitHub. Your contributions are welcome, whether fixing a typo (drat!) or suggesting an update ("yeah, this would be better").

