Known Limitations
Learn more about the Unity SDK's known limitations.
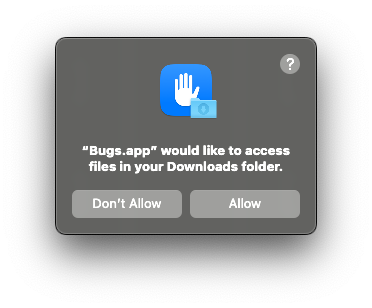
Starting with macOS Mojave (10.14), directories like Desktop, Documents, and Downloads are considered privacy-sensitive locations and are protected by the operating system's security sandbox. When running a Unity application from one of these locations, users might encounter a popup requesting access. This occurs because the default .NET HttpMessageHandler attempts to resolve domain names, which requires filesystem access. Note, that disallowing access to these locations does not affect the SDK from reporting errors.
Currently, line numbers are missing when programmatically subscribing to button click events via Button.onClick.AddListener. However, you can set up callbacks through the editor to work around this.
The SDK is currently limited to resolving IL2CPP line numbers when capturing errors. The SDK relies on an exception being available to extract the stacktrace. That means that either an unhandled exception needs to be caught by the SDK automatically or by calling SentrySdk.CaptureException manually.
When logging an error with Debug.LogError the logging integration captures this as message.
The exception provided by Unity that is getting captured by the logging integration does not contain a stacktrace. Use SentrySdk.CaptureException instead.
Currently, it is not possible for the SDK to distinguish between the user calling Debug.LogException and the SDK capturing an unhandled exception. To capture an exception and mark it as handled you can call SentrySDK.CaptureException instead.
Your stack traces might contain C++ frames. This might be because:
- The generated C++ code doesn't contain the
<source_info>annotation to point back to the C# code it was generated from. This can be due to optimization or the IL2CPP compiler generating code to handle C# specific features. - The C++ exception might return an incorrect line number which makes Sentry miss the
<source_info>annotation. You can try enabling uploading your source code in the debug symbol options to look at the generated C++ code.

This is also why you might end up with very high line numbers (in the several thousands) even though your C# script is very small; the line numbers relate to the generated C++ code.
Currently, the SDK fails to provide line numbers and source context in combination with Cysharp. For context, the SDK relies on Unity's IL2CPP backend to provide it with instruction addresses for Sentry generate line numbers in events. When using Cysharp, those instruction addresses default back to 0x0 once the stacktrace goes into the library. There is no known workaround for this.
When targeting WebGL, you have the option of setting the PlayerSettings.WebGL.exceptionSupport, but be mindful of the following limitations:
- Setting it to
WebGLExceptionSupport.Noneis not supported by the SDK. - For the SDK to be able provide stack traces, the support needs to be set to
WebGLExceptionSupport.FullWithStacktrace. - The SDK is currently not able to provide line numbers due to the IL2CPP backend not being available.
When building with Unity 2019, the ManagedStrippingLevel needs to be set to ManagedStrippingLevel.Low. Otherwise, the build will fail throwing the following error:
Fatal error in Unity CIL Linker
System.ArgumentException: Member 'System.Void System.Runtime.CompilerServices.NullableAttribute::.ctor(System.Byte)' is declared in another module and needs to be imported
Our documentation is open source and available on GitHub. Your contributions are welcome, whether fixing a typo (drat!) or suggesting an update ("yeah, this would be better").