Metric Alert Configuration
Learn more about the options for configuring a metric alert.
Sentry provides several configuration options to create a metric alert based on your organization's needs.
To create a metric alert you first need to choose a metric type. For some alert types the function is built into the alert and for others you can choose functions and parameters to apply to it. For example, if you select “Users Experiencing Errors”, that translates to the function, count_unique(user.id). Since editing this function would change the nature of the alert, it is not editable and thus hidden. On the other hand, if you select “Largest Contentful Paint” the measurement used is measurement.lcp, you also need to choose a function, e.g. p75(), for a combined metric function of p75(measurement.lcp).
When creating new metric alerts, the is:unresolved filter is added by default. This filter excludes events from archived and resolved issues. If you want your metric alerts to include archived issues, you can manually remove is:unresolved from your filters.
- Number of Errors
- Users Experiencing Errors
- Crash Free Session Rate
- Crash Free User Rate
- Throughput
- Transaction Duration
- Apdex
- Failure Rate
- Largest Contentful Paint
- First Input Delay
- Cumulative Layout Shift
- Custom Measurement
- Custom Metric
count()count_unique(...)avg(...)percentile(...)failure_rate()apdex(...)count()p50()p75()p95()p99()p100()
Choose the time period over which to evaluate your metric. Your choices range between one minute and one day. Sentry evaluates the specified window each minute. For example, if you specify an hour time window, Sentry evaluates:
- At 3:00pm: 2:00pm - 3:00pm
- At 3:01pm: 2:01pm - 3:01pm
- At 3:02pm: 2:02pm - 3:02pm
- ...
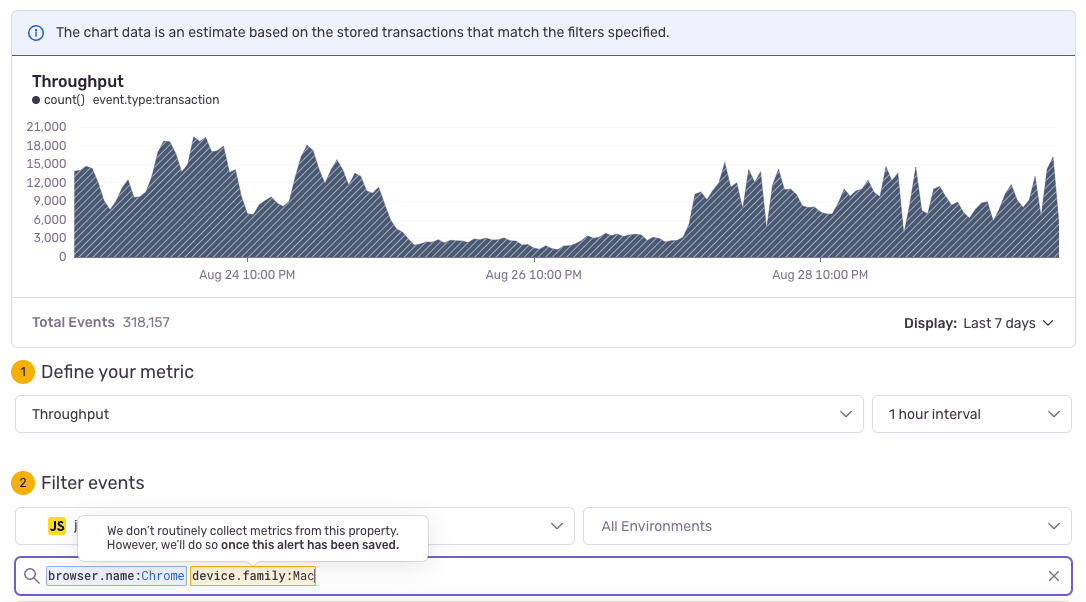
The following set of filters translates into a Discover query that is displayed in the chart at the top of the alert configuration page.
Specify which project will use this particular alert rule. Created alert rule will only process events from this project.
Specify which environment(s) will use this particular alert rule. This control filters on the environment tag in your events. This filter is helpful because the urgency and workflows you apply to production alerts might differ from those you apply to alerts originating from your QA environment, for example.
The “Environment” dropdown list here has the same environments that are available for the selected project in the common “Environment” filter dropdown (this does not include hidden environments). Selecting "All Environments" is equivalent to having no environment filter.
For some metric alerts, you can set the event type that you want to be alerted about in the “Events” dropdown:
event.type:errorORevent.type:defaultevent.type:defaultevent.type:error
Add filters in the provided input to narrow down what you'll be alerted about, such as tags or other event properties. Available properties depend on your alert's type:
- For error events, all error properties are available. See Searchable Properties for a full list.
- For transaction events, the following basic properties are generally available:
release,transaction,transaction.status,transaction.op,http.method,http.status_code,os.name,browser.name, andgeo.country_code.
This feature is only available to organizations with a Business or Enterprise plan.
A wider variety of fields or tags are available in addition to the basic properties mentioned above, so you can create more advanced filtering conditions. However, Sentry only starts collecting these metrics after the alert is saved. If such a filter is used, Sentry provides an estimate of the metric for the previous period during the alert's creation. A maximum of 50 alerts with advanced filters is allowed per project on certain legacy plans.
While Sentry won’t allow you to create new alerts with invalid or unavailable properties, any existing alerts with unavailable fields won’t be affected. But if you need to edit or duplicate them, you'll need to remove the unavailable properties.
There are three threshold types:
- Static: A fixed numerical threshold set by you. (For example, if there are 100 errors in a set period of time.)
- Percent change: A percent based threshold, such as when there are 10% more errors in a time period compared to a previous period. These are also referred to as Change Alerts.
- Anomaly: A dynamic threshold maintained by Sentry that detects anomalies whenever values fall outside of expected bounds.
By default, metric alerts use a fixed threshold.
This feature is available only if your organization is on a Trial, Business, or Enterprise plan.
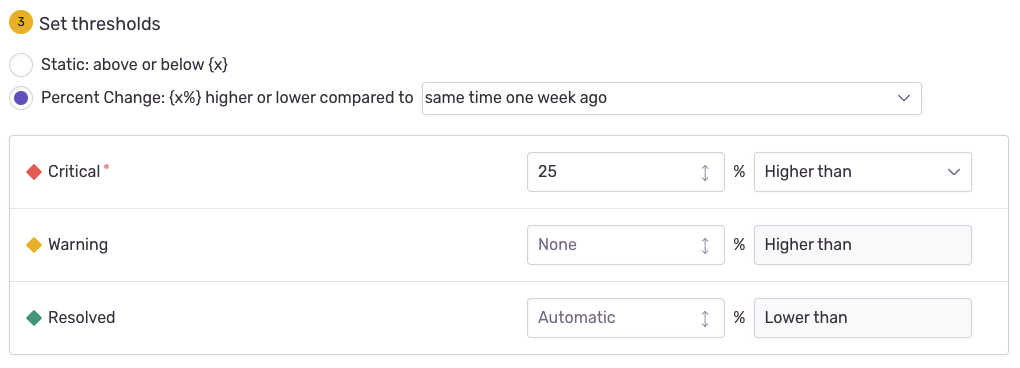
Change alerts, or alerts that use a percent change threshold, are useful when you want to know if a metric is significantly different from normal. To do this, you’ll need to pick a metric interval (when you're selecting your metric type) and a time against which to compare. One example would be comparing the number of errors in the last hour to the same time period one week ago. If errors are 25% higher in the last hour than they were in the same period a week ago, then an alert will trigger.
This feature is available only if your organization is on a Trial, Business, or Enterprise plan.
Anomaly alerts automatically detect trends outside expected values. They can be especially helpful for spiky or seasonal data that are too noisy for static or percentage based thresholds. Sentry will look at historical data for the given metric and determine if the current data is anomalous. Certain metrics, like Apdex, are currently not supported for anomaly alerts.
Behind the scenes, anomaly alerts use a combination of two open-source algorithms—Matrix Profile and Prophet Forecasting—to detect unusual patterns and forecast expected trends. By blending these approaches, Sentry can better distinguish true anomalies from normal fluctuations, reducing false positives and false negatives.
There are three options for alert responsiveness: low, medium, and high. If you choose low responsiveness, then your alert will fire less frequently but with higher confidence. If you choose high responsiveness, then your alert will fire more frequently with a greater chance of false positives. Our recommendation is to start with medium responsiveness, our default, and adjust the responsiveness based on the results you see.
Another setting is to set the direction of the alert: above and/or below the expected bounds. This setting can help increase the signal of your alert rule.
You can set the status of an alert rule when a threshold is met using the labels:
- Critical
- Warning
- Resolved
You must set the “Warning” threshold so that it’s triggered before the “Critical” threshold. When Sentry evaluates an alert, the alert’s status is updated to the highest severity trigger that matches. If you don’t set a “Resolved” threshold, the alert automatically resolves when it's no longer breaching the “Critical” or “Warning” conditions. You can also resolve alerts manually.
Note: Anomaly alert thresholds are controlled by Sentry and cannot be manually configured.
By default, metric alerts are resolved automatically when the specified metric is no longer breaching the “Critical” or “Warning” conditions. However, you can set a different resolution threshold. For example, suppose a normal level of errors for your app is less than 2000/minute, and you want to be alerted when that exceeds 5000/minute. You might want the alert to resolve only if the level of errors goes back below 2000/minute, not 5000/minute. By setting the "Resolved" threshold this way, if the error level comes back down to only 4000/minute, which you’d consider problematic even though it’s below your alert threshold, the alert won't resolve.
Actions define how you and your team will be alerted:
- Send an email to a member or team. If sent to a member, the member's personal project alert opt-out settings are overridden.
- Send a Slack notification.
- Send a Discord notification.
- Trigger a PagerDuty incident.
- Send a Microsoft Teams notification.
- Send a request using Sentry integrations.
Learn more about routing alerts with integrations.
Give your alert a descriptive name, such as the team affected and the topic of the alert. For example, "Frontend Latency", "Backend Failure Rate", or "Billing Apdex". This name must be unique at the organization level; that is, no other metric alert created in your org can have the same rule name.
You can choose a team to associate with an alert so that members of that team can edit this alert. Note that you can only make this association if you are a member of the team. If no team is selected, anybody can edit the alert.
Our documentation is open source and available on GitHub. Your contributions are welcome, whether fixing a typo (drat!) or suggesting an update ("yeah, this would be better").


