Alert Types
Learn about the three types of alerts Sentry provides: issue alerts, metric alerts, and uptime monitoring alerts.
You can create three types of alerts:
- Issue alerts: Trigger when an issue matches a specific criteria.
- Metric alerts: Trigger when macro-level metrics cross specific thresholds.
- Uptime alerts: Trigger when an HTTP request doesn't return a successful response.
Issue alerts trigger whenever a new event is received for any issue in a project matching the specified criteria. These criteria might be, for example, a resolved issue re-appearing or an issue affecting many users.
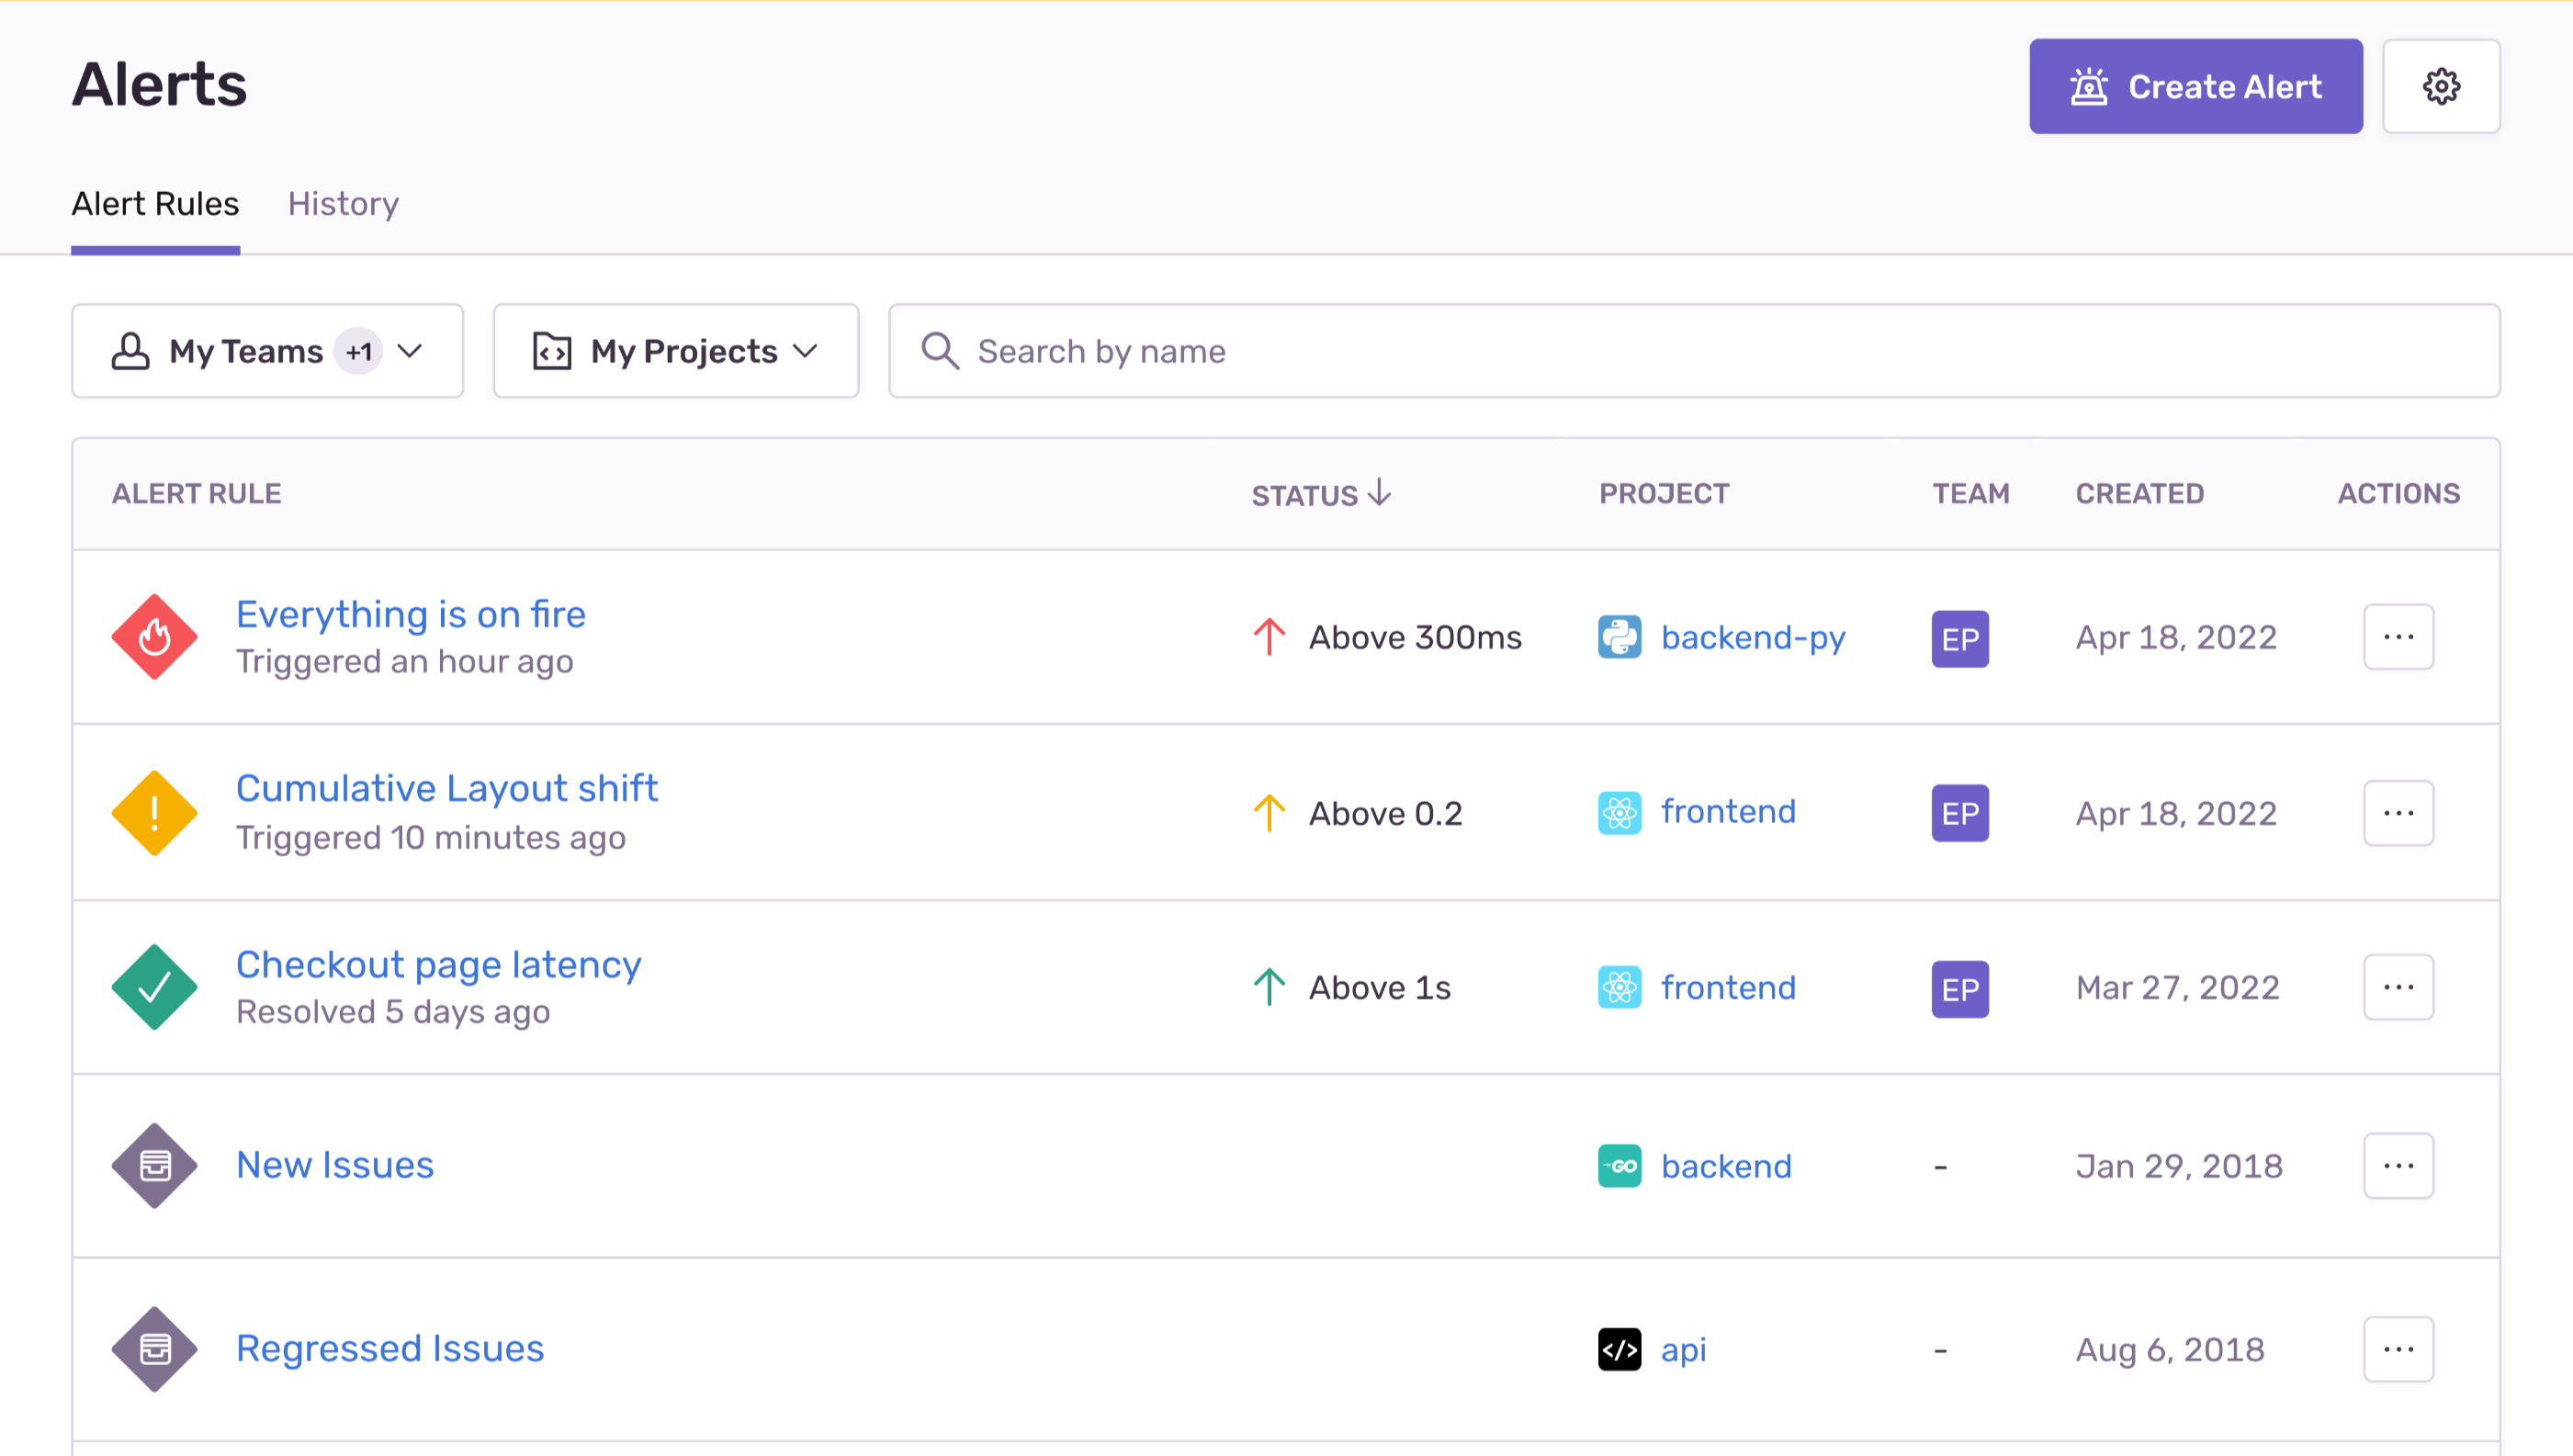
In the “Alert Rules” tab, these alerts are identified by the issues icon, and by default, they are displayed at the bottom of your list of alerts. (If you have several metric alerts, this may push your issue alerts off the first page of the list.)
In issue alerts, Sentry evaluates the configured alert conditions each time it receives a new event. Alert conditions have three parts:
- Triggers specify what type of activity you'd like monitored, or When an alert should be triggered.
- Filters help control noise by triggering an alert only If the issue matches the specified criteria.
- Then, Actions specify what should happen when the trigger conditions are met and the filters match.
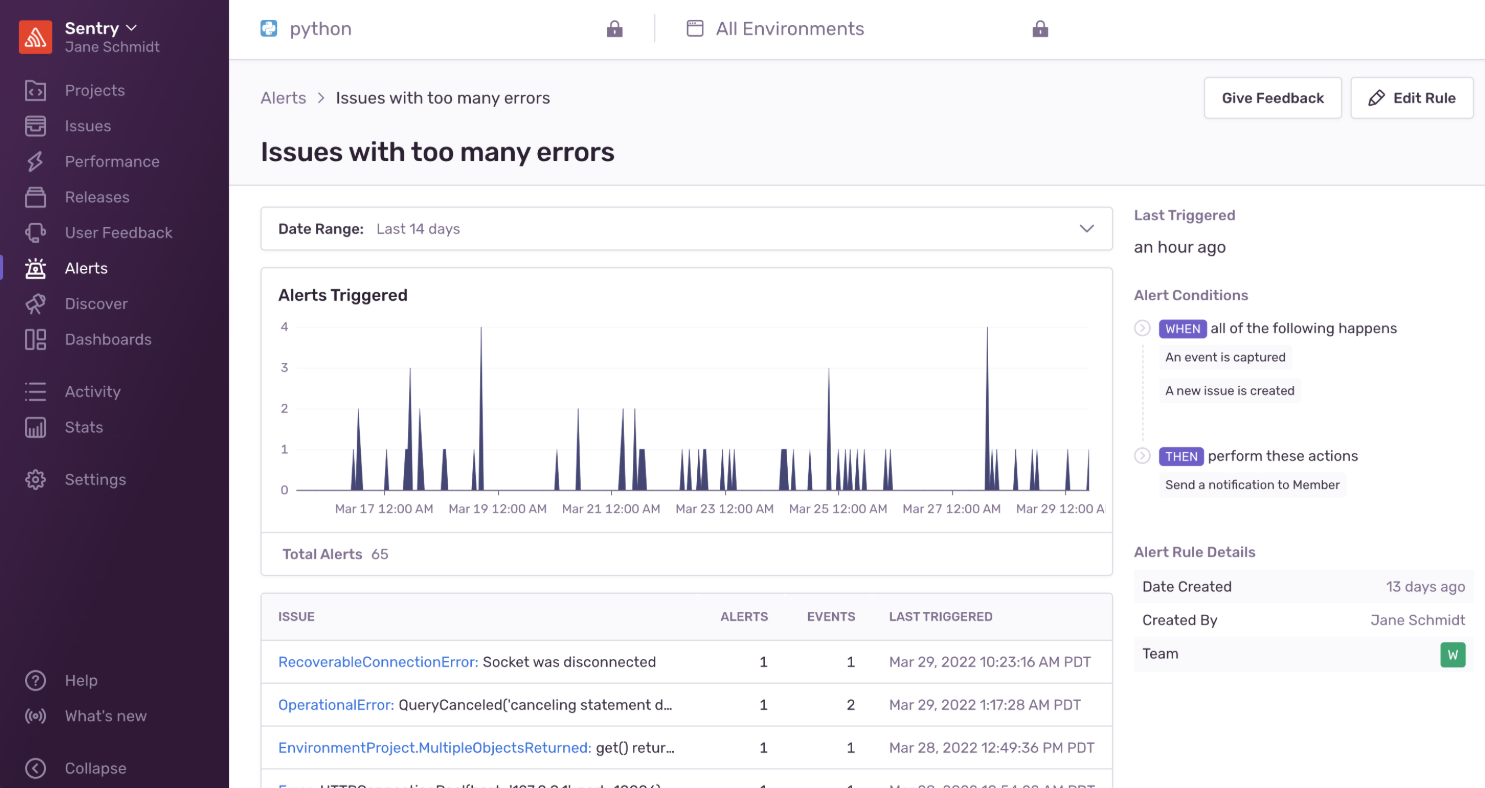
The Alert Details page shows you the number of times an issue alert rule was triggered over time, grouped in one hour buckets. Clicking on the alert rule name in the "Alert Rules" tab, or on the notification you receive will take you to this page. The page also includes the alert rule conditions, the current status of the alert (Warning, Critical, or Resolved), and alert details such as when it was created, when it was last modified, and the team that owns the alert.
The Alert Details page also includes a list of issues that triggered the alert. You can click on any of the issues in the list to go to that issue's details page for more information.
This feature is available only if your organization is on a Team plan or higher.
Metric alerts tell you when a metric crosses a threshold set by you, like a spike in the number of errors in a project, or a change in a performance metric, such as transaction duration, Apdex, failure rate, or throughput. You can use dynamic alerts to let Sentry define the threshold for you.
Metric alerts monitor macro-level metrics for both error and transaction events. A metric takes a set of events and computes an aggregate value using a function, such as count() or avg(), applied to the event properties over a period of time. When you create a metric alert, you can filter events by attributes and tags, which is particularly useful for aggregating across events that aren't grouped into single issues. Sentry allows a maximum of 1000 metric alerts for an organization.
Metric alerts may include archived issues if events from those issues match the filters of your metric alert rule. Events from archived and resolved issues can be filtered out by using the is:unresolved filter in your metric alert rule. This filter is added by default when creating a new metric alert, but you may need to manually add it to older metric alerts if you want them to exclude archived issues.
These alerts use Critical and Warning triggers to measure severity. An alert’s current status is the highest severity trigger that is active, which can be one of three values: Warning, Critical, or Resolved. Sentry notifies you whenever an alert's status changes.
When you create an alert, all the displayed alert types (except “Issues”) may be used to create a metric alert. You can create metric alerts for Errors, Sessions (Crash Rate Alerts), and Performance:
Error alerts are useful for monitoring the overall level of errors in your project, errors occurring in specific parts of your app, or errors affecting your users.
Number of Errors: Alerts when the number of errors in a project matching your filters crosses the threshold you set.
Users Experiencing Errors: Alerts when the number of users affected by errors in your project crosses the threshold you set.
Crash rate alerts can give you a better picture of the health of your app on a per project basis or in a specific release. They trigger when the crash-free percentage for either sessions or users falls below a specific threshold. This could happen because of a spike in the number of session or user crashes.
Crash Free Session Rate: Alerts when the number of crashed sessions exceeds the threshold you set. A session begins when a user starts the application and ends when it’s closed or sent to the background. A crash is when a session ends due to an error.
Crash Free User Rate: Alerts when the overall user experience dips below the threshold you set. Crash Free Users represents the percentage of individual users who haven’t experienced a crash.
Application performance alerts can help you pinpoint and identify specific problems that may be causing a suboptimal experience for your users.
Throughput: Alerts when throughput (the total number of transactions in a project) reaches a threshold set by you within a specified period of time.
Transaction Duration: Alerts when transaction durations meet certain conditions.
TIP: The conditions can be customized with flexible aggregates like percentiles, averages, and min/max.
Apdex: Alerts on the Apdex score (the ratio of satisfactory, tolerable, and frustrated requests in a specific transaction or endpoint). Apdex is a metric used to track and measure user satisfaction based on your application response times.
Failure Rate: Alerts on failure rate (the percentage of unsuccessful transactions). Sentry treats transactions with a status other than “ok,” “canceled,” and “unknown” as failures.
Largest Contentful Display: Alerts when the Largest Contentful Paint (LCP), which measures loading performance, is loading slower than expected. LCP marks the point when the largest image or text block is visible within the viewport.
TIP: A fast LCP helps reassure the user that the page is useful. We recommend an LCP of less than 2.5 seconds.
- First Input Delay: Alerts when First Input Delay (FID), which measures the response time when a user tries to interact with the viewport, is longer than expected.
TIP: A low FID helps ensure that a page is useful. We recommend a FID of less than 100 milliseconds.
- Cumulative Layout Shift: Alerts when cumulative Layout Shift (CLS), which measures visual stability by quantifying unexpected layout shifts that occur during the entire lifespan of the page, increases.
TIP: A CLS of less than 0.1 translates to a good user experience, while anything greater than 0.25 is poor.
- Custom Metric: Alerts on metrics which are not listed above, such as first paint (FP), first contentful paint (FCP) and time to first byte (TTFB).
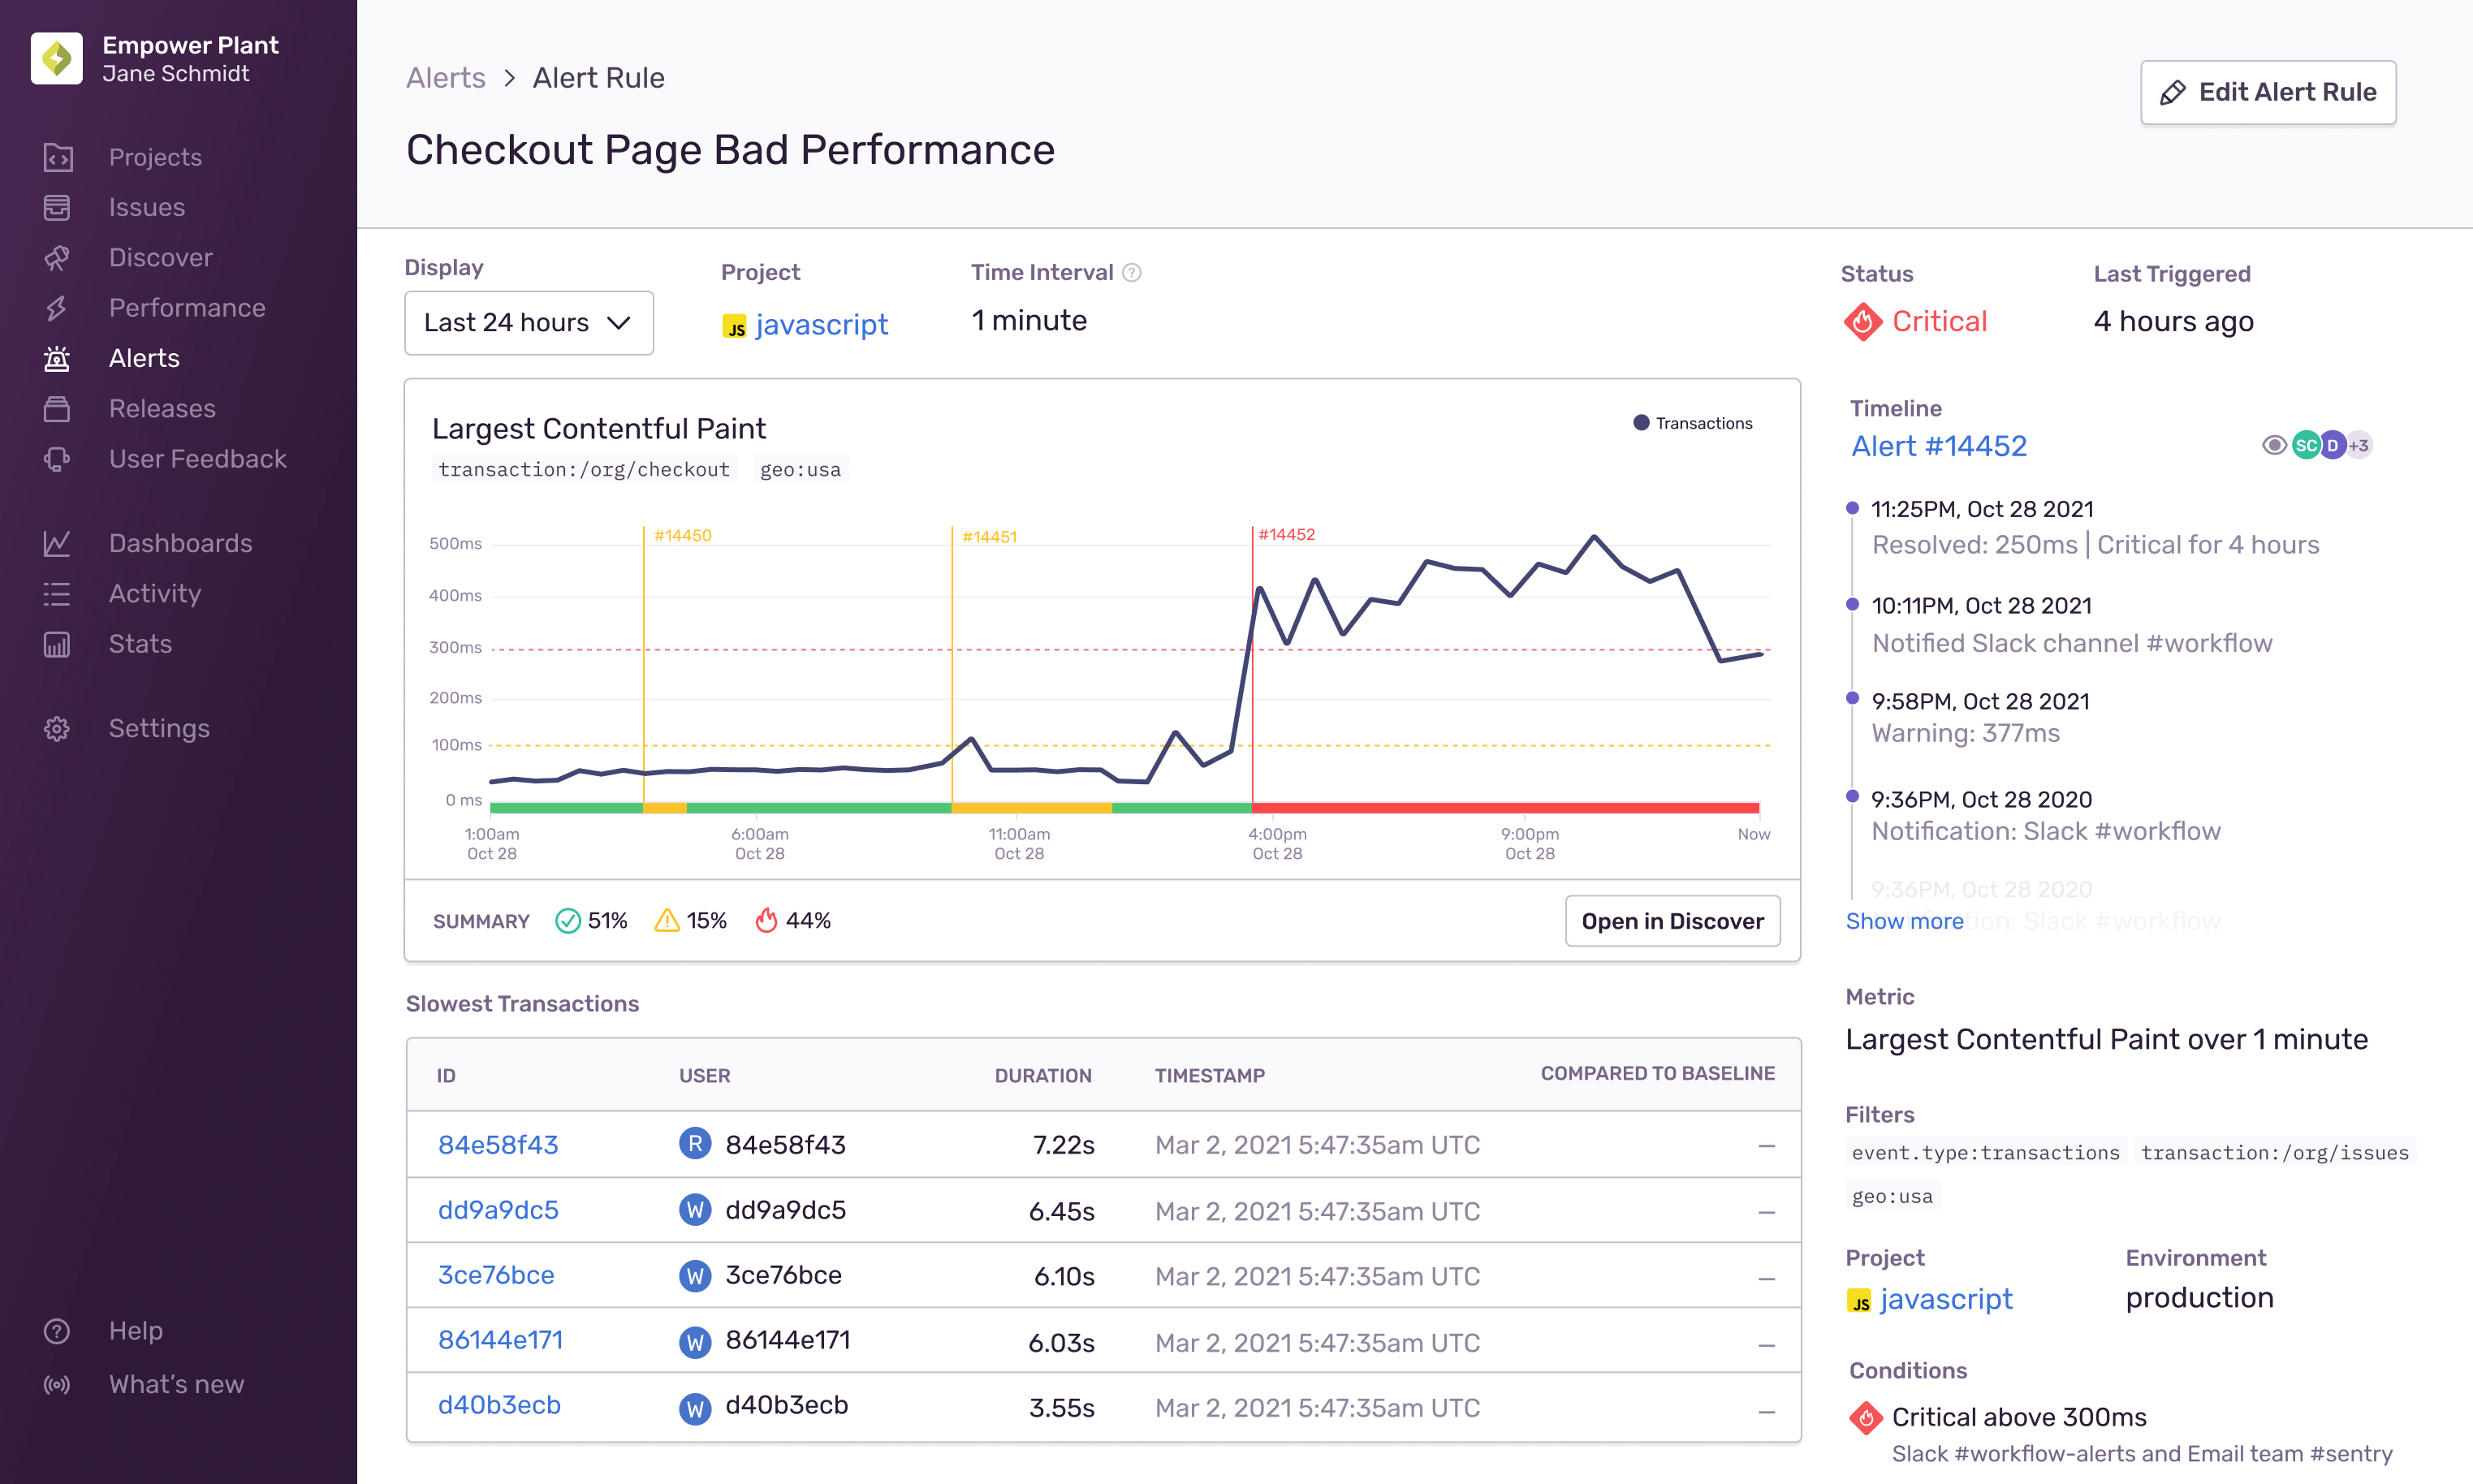
The Alert Details page shows you the history of a metric alert rule for the last 24 hours by default, though can modify the time period using the "Display" dropdown. When an alert is triggered, clicking the notification you receive takes you to this page, which displays the period when the alert was active. The page also includes details such as the alert rule conditions, the current status of the alert, and a summary of how much time the alert spent in each state (Critical, Warning, or Resolved).
The Alert Details page also includes a list of suspect issues or transactions related to the metric, to help pinpoint the root problem more quickly. You can see what might have caused the alert to be triggered, and then open the metric in Discover to find more information.
Uptime alerts trigger whenever an uptime check request fails to meet our uptime check criteria. You'll be able to see the latest uptime check request status ("Up" or "Down") in the “Alert Rules” tab.
The Alert Details page provides a timeline of uptime check events associated with the alert. This timeline allows you to track when and where failures occurred. Selecting a section of the timeline automatically updates the date range filter, enabling you to browse historical uptime check data.
The Alert Details page also includes a list of uptime issues that were created by the alert when uptime failures are detected. Clicking on any of the issues will take you to a page with additional information that may help you debug that issue.
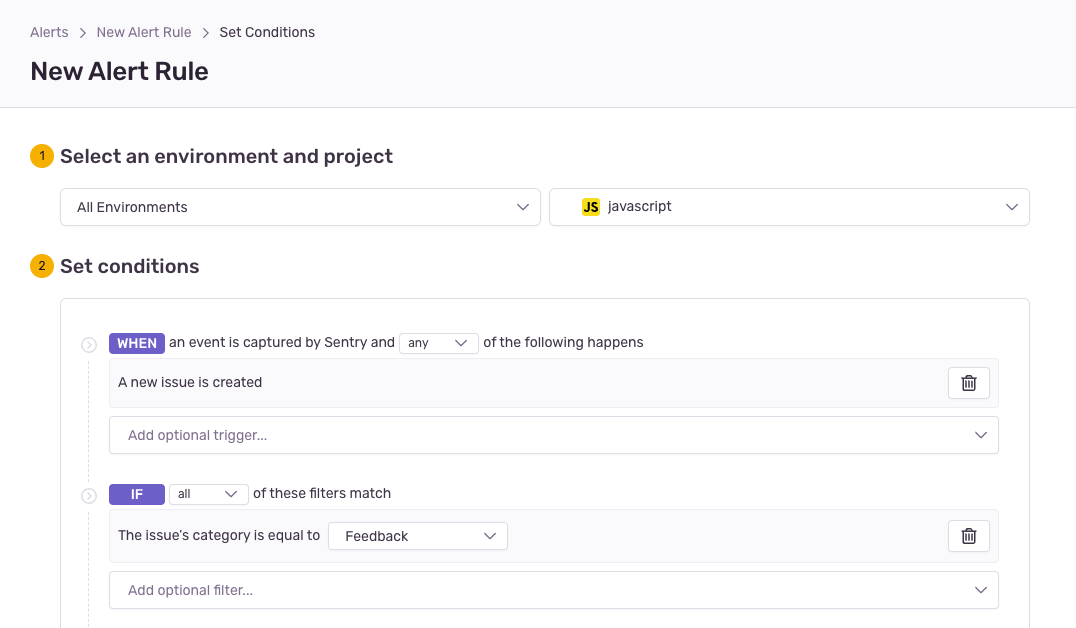
You can enable alerts for the User Feedback Widget on the issue alerts page by following the steps below:
- Create a New Alert Rule in Sentry.
- Scroll to the "Set conditions" section and set the "IF" filter to
The issue's category is equal to… "Feedback". - Choose which actions to perform in the “THEN” filter.
- Add an alert name and owner.
To get alerts when crash-report feedback comes in, make sure to turn on "Enable Crash Report Notifications" in Settings > Projects > [Project Name] > User Feedback.
Our documentation is open source and available on GitHub. Your contributions are welcome, whether fixing a typo (drat!) or suggesting an update ("yeah, this would be better").


