Trends
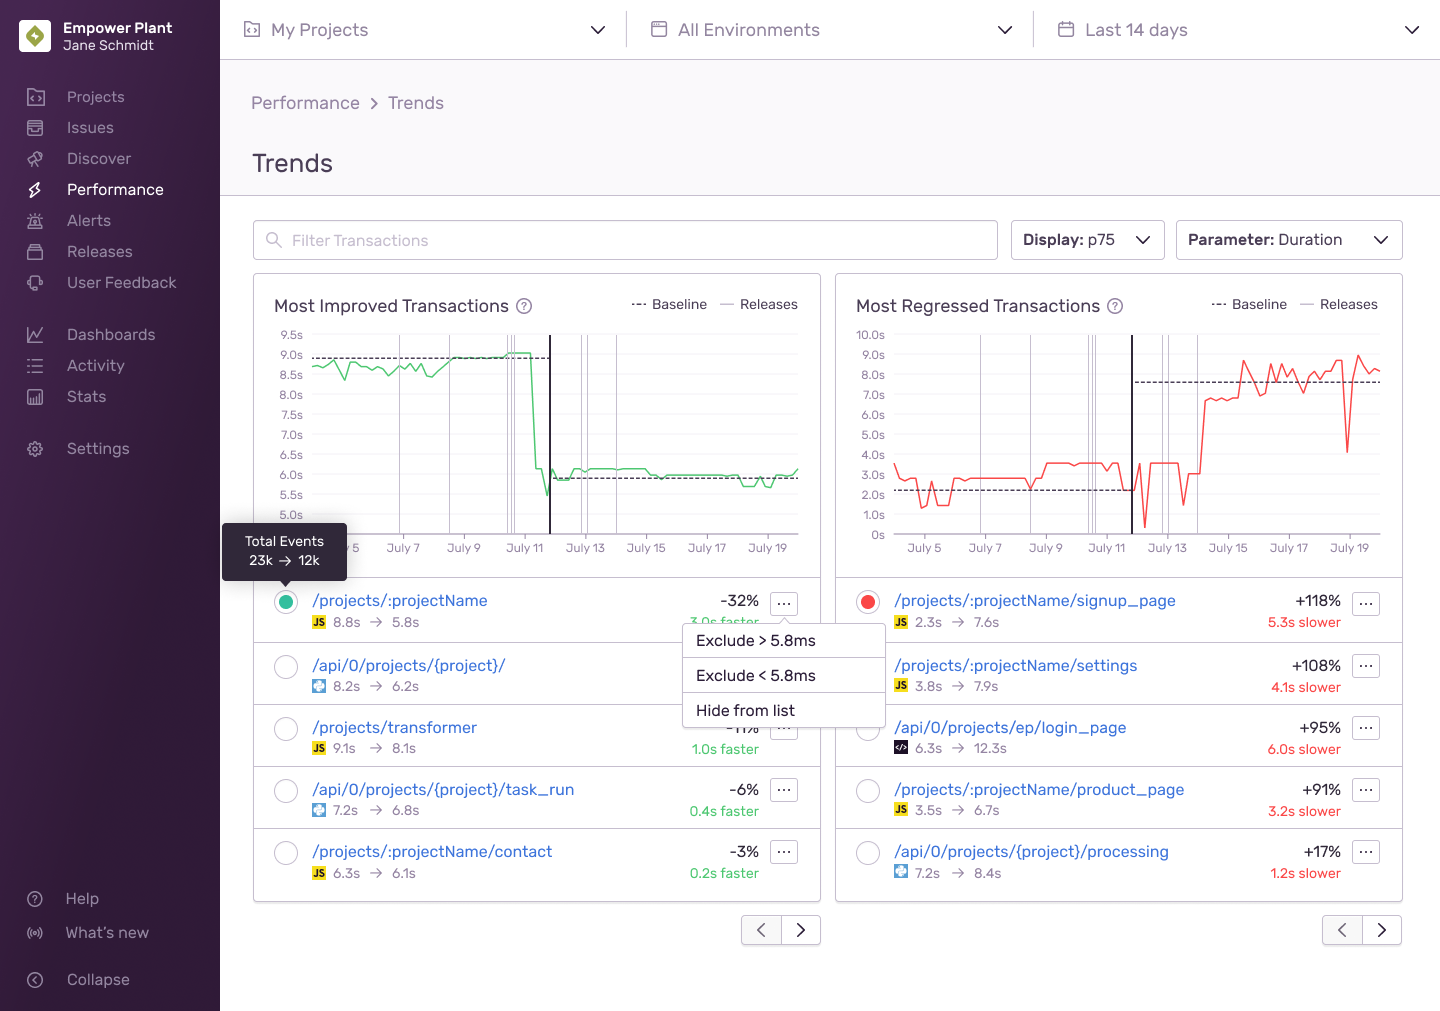
Learn more about the Trends view, which allows you to see significant changes in performance over time.
From the Performance homepage, you can find the Trends View by toggling the tab in the Performance homepage's upper right corner. This page surfaces transactions that have had significant changes in their performance over time.
Trending transactions are calculated first by filtering out transactions with large throughput fluctuations, determining the baselines of the two halves of the duration, and calculating their percentage change. Regressions are any percentage changes greater than zero, while improvements are percentage changes less than zero. Sentry uses a t-test to compare the before and after periods of the transaction and assign a confidence score.
For example, looking at a transaction over two weeks with the default P50 baseline, if the first week had a p(50)=100s, and the second a p(50)=110s, the percentage is (110/100)-1 = 0.1. The example transaction had a performance regression of 10%.
The more data is available, the more the accuracy of the trend improves. For this reason, trends perform best over long periods and with transactions with large counts.
While we default the baseline calculation to use P50, you can change the baseline calculation via the dropdown. Other options include P75, P95, P99, and average, and this baseline is used to determine the percentage change.
Our documentation is open source and available on GitHub. Your contributions are welcome, whether fixing a typo (drat!) or suggesting an update ("yeah, this would be better").
