Query Builder
Learn how to use Discover to build a query, filter your data, and group results.
This feature is available only if your organization is on a Trial, Business, or Enterprise plan.
From the Discover page, you can build a query in three ways.
- Click on "Build a new query"
- Click on the ellipsis of an existing saved query card to "Duplicate"
- Go into any existing query
- Click on "Save as..." in the top right
- Enter a new display name
- Click "Save"
There are five main building blocks that impact the results of your saved query, a combination of which can be used to narrow down your search:
- Dataset selection
- Project, environment, and date range filters
- Search conditions
- Interactive graph
- Table columns
The dataset selector allows you to query for either errors or transactions. You can only query one dataset at a time. The errors dataset returns events related to errors, while the transactions dataset returns transaction events that help you see application performance.
These common filters allow you to filter on your projects and environments, as well as specify the date range you want to zoom in on.
All events have built-in key fields or custom tags. Use the search bar to enter these keys and assign them values. This will filter down your list of events. For a list of the built-in key fields, check out our Searchable Properties documentation.
The Query Builder syntax is identical to Sentry's Search syntax. After you enter a key field from above or a custom tag, you can use any of the referenced syntax. For example, count() gives you the number of times an event occurs. This can be written in the following ways:
- Exact match (is equal to):
count():99 - Upper bounds (is less than or equal to):
count():<99orcount():<=99 - Lower bounds (is more than or equal to):
count():>99orcount():>=99 - Multiple bounds (is more and less than):
count():>10 count():<20
Use OR and AND search conditions between filters. However OR cannot be used between aggregate and non-aggregate filters. For more details about these conditions, see Using OR and AND.
You can also search multiple values for the same key by putting the values in a list. For example, "x:[value1, value2]" will find the same results as "x:value1 OR x:value2". You can learn more in our content covering Multiple Values on the Same Key.
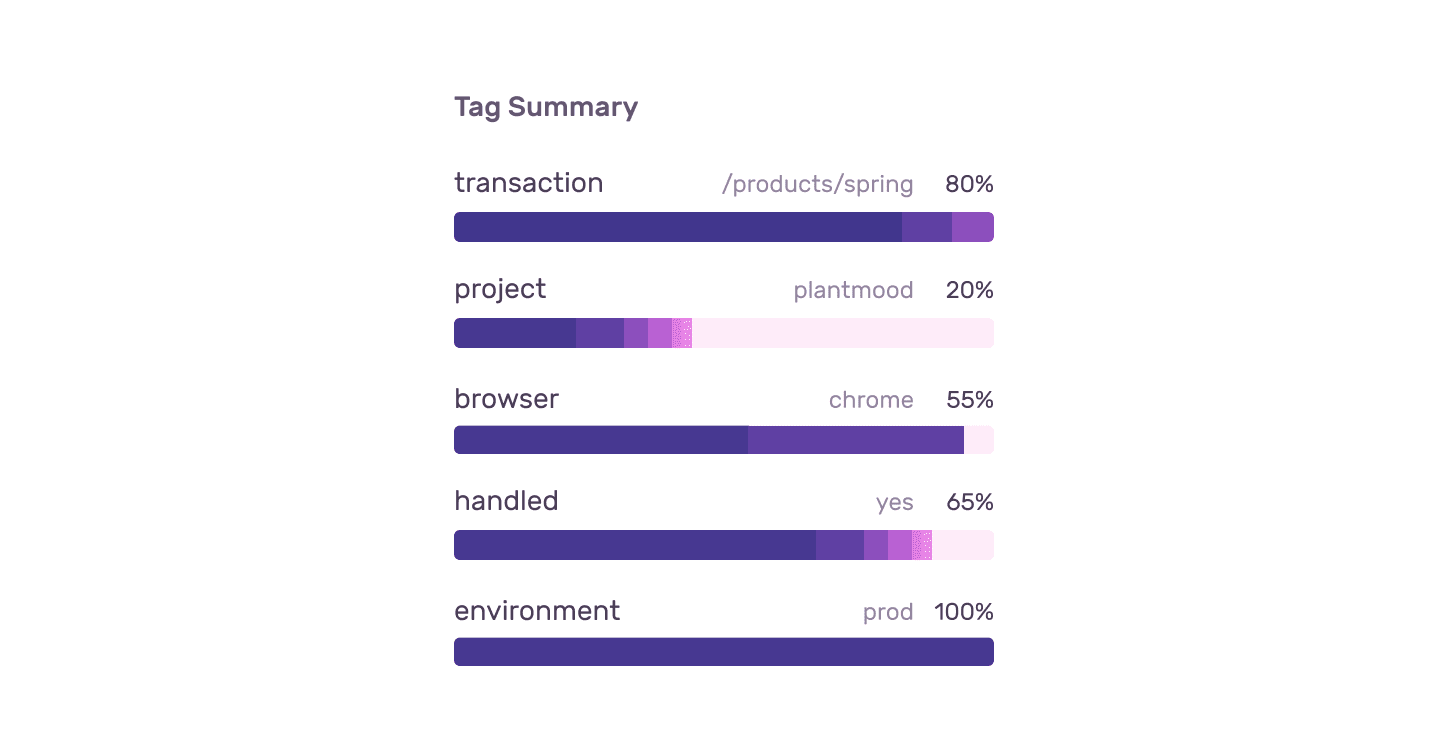
Every event has a list of tag values. The tag summary (or facet map) is a visualization of the top 10 keys sorted by frequency. The most common tag value is listed directly above the bar in the description and percentage. Hover over each section in a bar to see the exact distribution for that tag.
Click on any of these sections to further refine your search. For example, clicking on a section that represents Chrome in a browser bar will automatically update the tag summary and then add Chrome to the search conditions.
When performing searches on transaction events, based on your search criteria and sample rate, the events available may be limited because Discover uses sampled data only. Learn more by reading about our sampling priorities.
Each query has a interactive graph that reflects the data presented in the table below. To zoom in, simply click and drag over the area you want to investigate. You can also customize the display and the Y-Axis. This will be saved with your query.
The "Interval" selector allows you to change the date groupings in the graph. The selector has limits that are based on the currently selected time range. This means, for example, if you're querying over 90 days, the largest interval you can select is 45 days and the smallest is one hour.
- Total Period
- Previous Period
- Release Markers
- Top Period
- Total Daily
- Top Daily
- Bar Chart
When the "Display" selection is either "Top Period" or "Top Daily", an optional limit can be set. The setting defaults to five, showing the top five results in the graph.
- Count
- Average Transaction Duration
- p75
- p95
- Unique User Count
When your "Display" selection is either "Total Period", "Previous Period", "Total Daily" or "Bar Chart", you can set up to three y-axes by selecting multiple checkboxes in the "Y-Axis" dropdown.
Above the table, click "Columns" to open the modal that shows you a list of all the columns in the results table. You can add, delete, and move basic key field columns or custom tag columns by which results are grouped.
You can also add the following functions as columns to stack events, depending on the selected dataset:
count()count_if(...)count_unique(...)eps()epm()
any(...)apdex(...)avg(...)count()count_if(...)count_miserable(...)count_unique(...)count_web_vitals(...)epm()eps()failure_count()failure_rate()last_seen()max(...)min(...)percentile(...)p50(...)p75(...)p95(...)p99(...)p100(...)sum(...)user_misery(...)
Each function will ask you to assign a parameter. Some are required while others are optional. Functions will stack events based on the same values. If no functions are applied, the events in your "Query Results" table will remain individually listed. Once you are done editing the columns, click "Apply" and results will be reflected in the query results. Keep in mind, the table may horizontally scroll if many columns are added.
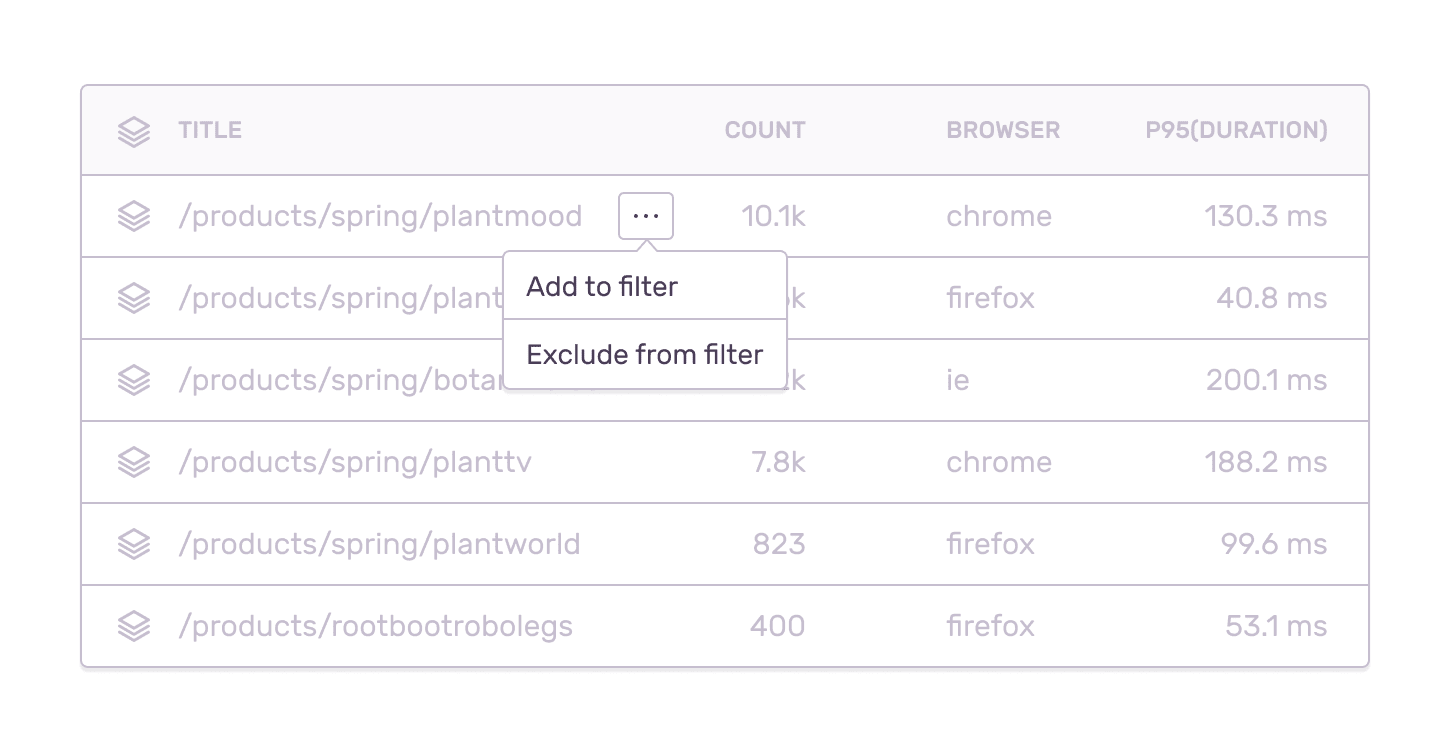
Each cell in the table will have an ellipsis appear on hover. This will open a context menu with additional filtering capabilities depending on the value type. For example, you can selectively target a transaction to the search conditions bar by clicking on "Add to filter".
You can also add equations to your query using the table columns as equation variables, and the results will be displayed in the query results table. Learn more in Adding Query Equations.
Click on the column header you would like to sort. A down arrow sorts the column in descending order and an up arrow sorts the column in ascending order. This may refresh the table.
If you need to edit any of these queries, go into the query, make the desired changes and a button will appear in the top right asking you to save/update the query. Keep in mind, edits to the query conditions will not be automatically saved.
To rename a saved query, click on the pencil icon by the header and enter the desired display name. Click "enter" or outside of the area to confirm.
Share your queries as often as you want. You can share URLs with other users who also have access to the same organization. As each part of the query is built, the results update, and the URL is updated so that in-progress searches can be shared in email, chat, etc.
If you want to take the data elsewhere, click on "Export" for a CSV file.
For a large export, you'll receive an email with the download link once it's ready. This will require further verification on the Sentry Download page. This contains a SHA1 checksum of the file, which you can use to verify its integrity with the following command:
echo "<SHA1 checksum> <downloaded CSV name>" | sha1sum -c -
Depending on the amount of data, the wait times can vary. The results are limited to 10 million rows or 1GB, whichever comes first.
On the Discover page, each saved query card has an ellipsis that will open a context menu. Delete the query from here. You can also delete the query within Query Results view by clicking the trash can in the upper right.
For more details on how to view saved queries, see the full documentation on Discover
Our documentation is open source and available on GitHub. Your contributions are welcome, whether fixing a typo (drat!) or suggesting an update ("yeah, this would be better").

