Custom Dashboards
Learn how to edit or create additional dashboards to suit your organization's needs.
This feature is available only if your organization is on a Trial, Business, or Enterprise plan.
Custom dashboards are shared across your organization, and users can view each other’s custom dashboards in the management view. Note that any changes you make are global, and will appear for users across the entire organization.
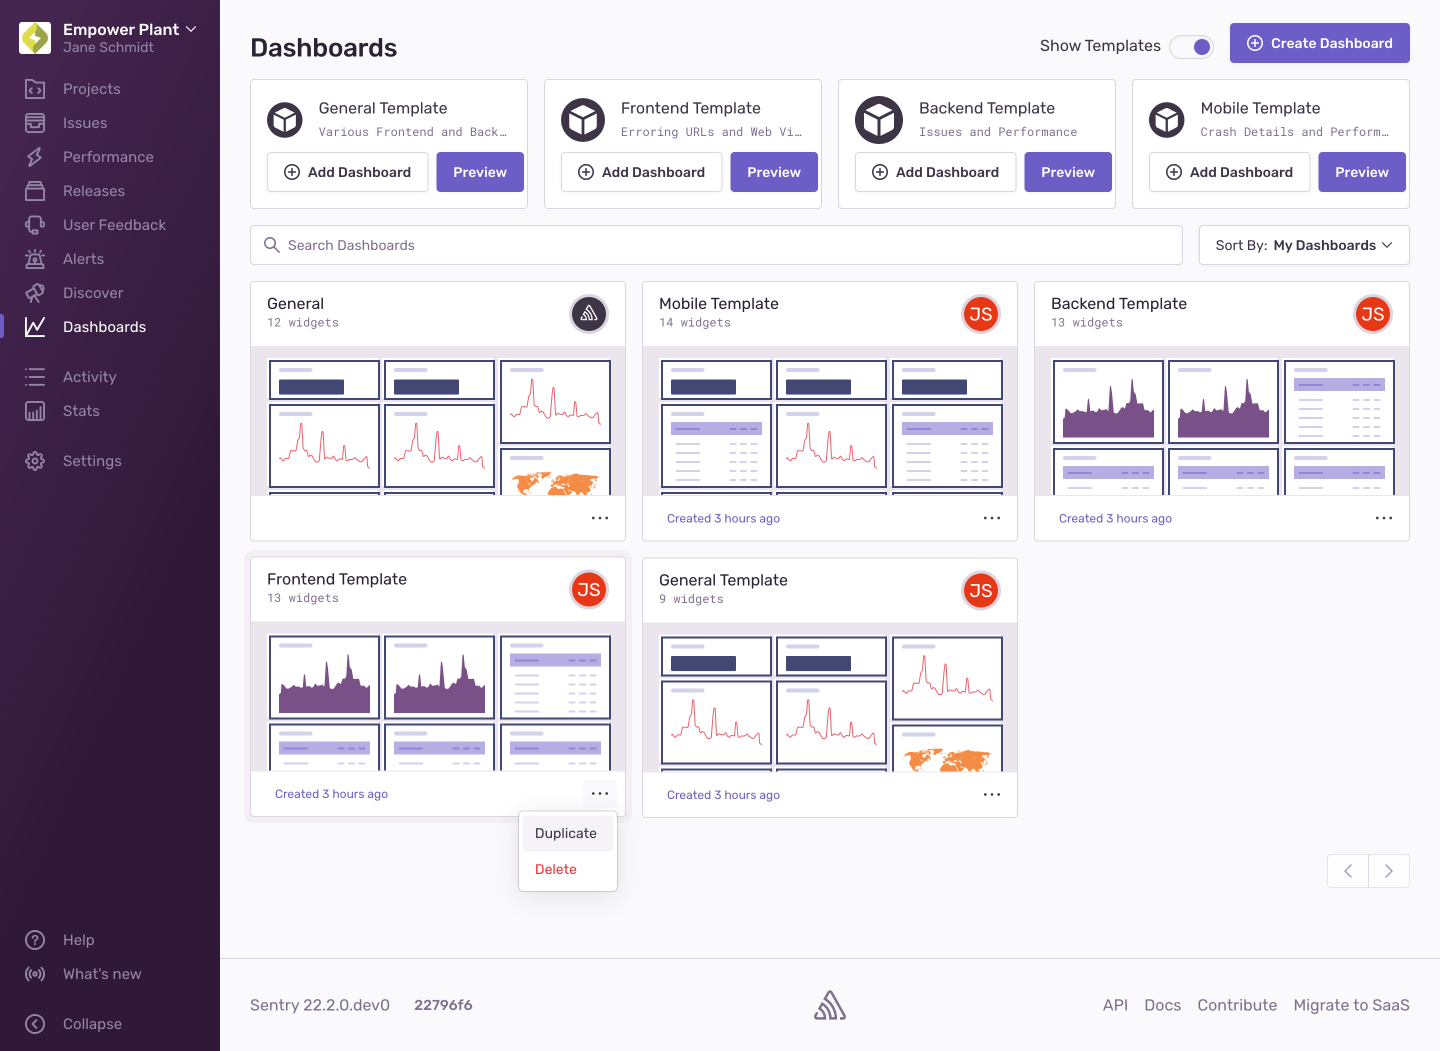
When you have either a Business or Trial Plan, navigating to Dashboards takes you to a view where you can manage dashboards instead of the default dashboard. From here, you can:
- Create a dashboard
- Create a dashboard from a template
- Duplicate a dashboard
- Delete a dashboard
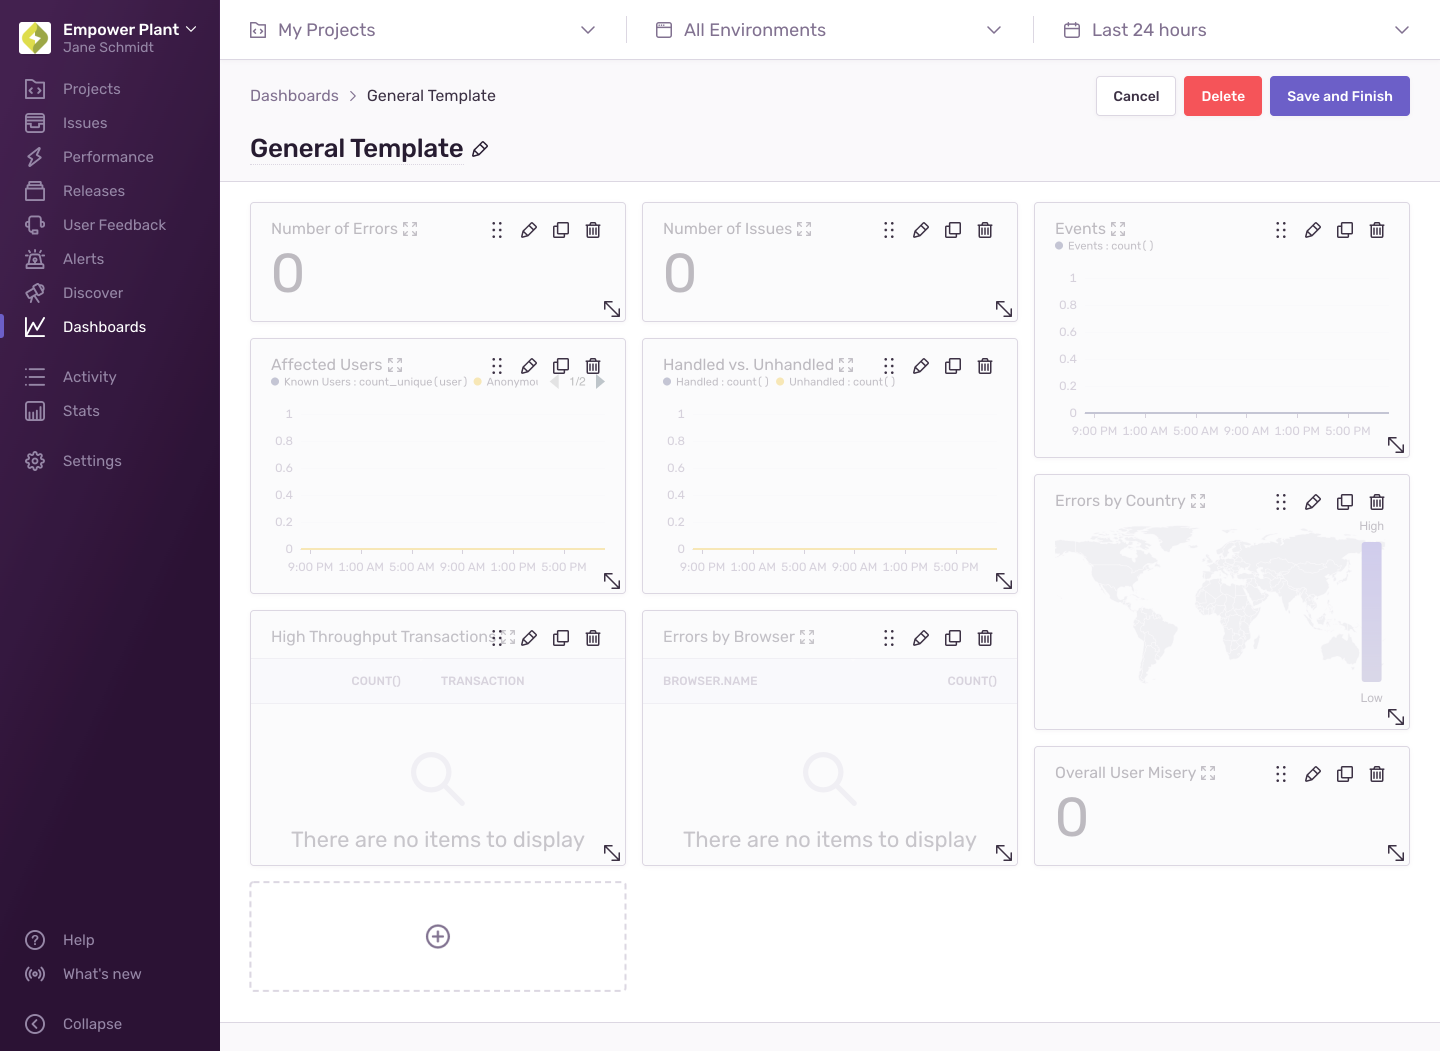
Clicking "Create Dashboard" takes you to a new dashboard where you can immediately begin adding widgets. When you're creating a new dashboard or editing an existing one, the widgets are slightly grayed out. From here, you can:
- Rename the dashboard
- Add and remove widgets
- Rearrange existing widgets
- Resize existing widgets
When the "Show Templates" toggle is enabled, several default dashboard templates are displayed. You can add each template directly to the list of dashboards by clicking "Add Dashboard", or preview it by clicking "Preview". You have to add a template before you can edit the resulting dashboard. You can also duplicate or delete a dashboard created from a template (this does not delete the template).
Dashboard filters are applied to all the widgets in your dashboard. They consist of page filters that allow you to narrow down the widget results to certain projects, environments, and date ranges, and a release filter that restricts the data to certain releases. Changing a dashboard filter will prompt you to "Save" or "Cancel". To persist filter changes to your dashboard, click "Save", or click "Cancel" to discard the changes.
When adding a widget or editing an existing one, you will be taken to a new page where you can see the dashboard widget builder. The widget builder has several configuration options that you can use to shape data and add information to your dashboard. Learn more in the Widget Builder documentation.
This feature is available only if you're in the Early Adopter program. Features available to Early Adopters are still in-progress and may have bugs. We recognize the irony.
If you're using custom tags or custom filters in your widgets, we will start collecting metrics to give you accurate counts and rates. During widget creation or editing, you will see approximate metrics for transaction datasets based on indexed events. As soon as you save, we will start extracting metrics for those widgets. It may take up to 15 minutes to start seeing metrics.
Learn more about the feature and limitations of metrics extraction.
The widget library contains a collection of prebuilt widgets you can add to your custom dashboards. Learn more in the Widget Library documentation.
Our documentation is open source and available on GitHub. Your contributions are welcome, whether fixing a typo (drat!) or suggesting an update ("yeah, this would be better").

