Manage Your Error Quota
Learn how to use the tools Sentry provides to control the type and amount of errors that you pay for.
Sending all your application errors to Sentry ensures you'll be notified in real-time when errors occur in your code. However, with a basic setup, you may consume your error quota too rapidly and trigger more notifications than you can use. Sentry provides tools to control the type and amount of errors that are monitored. These tools allow you to:
- Receive more actionable and meaningful error events.
- Reserve real-time notifications for errors that actually break your code.
- Manage your error quota.
Applying the proper filters, SDK configuration, and rate limits is an iterative and on-going process, but these tips will show you how to get the most out of your error events. These tips are ordered from easiest or least time-consuming to most challenging or potentially time-consuming. Options 1-5 are all things you can do in sentry.io, whereas the remaining ones are things you'll do in the SDK.
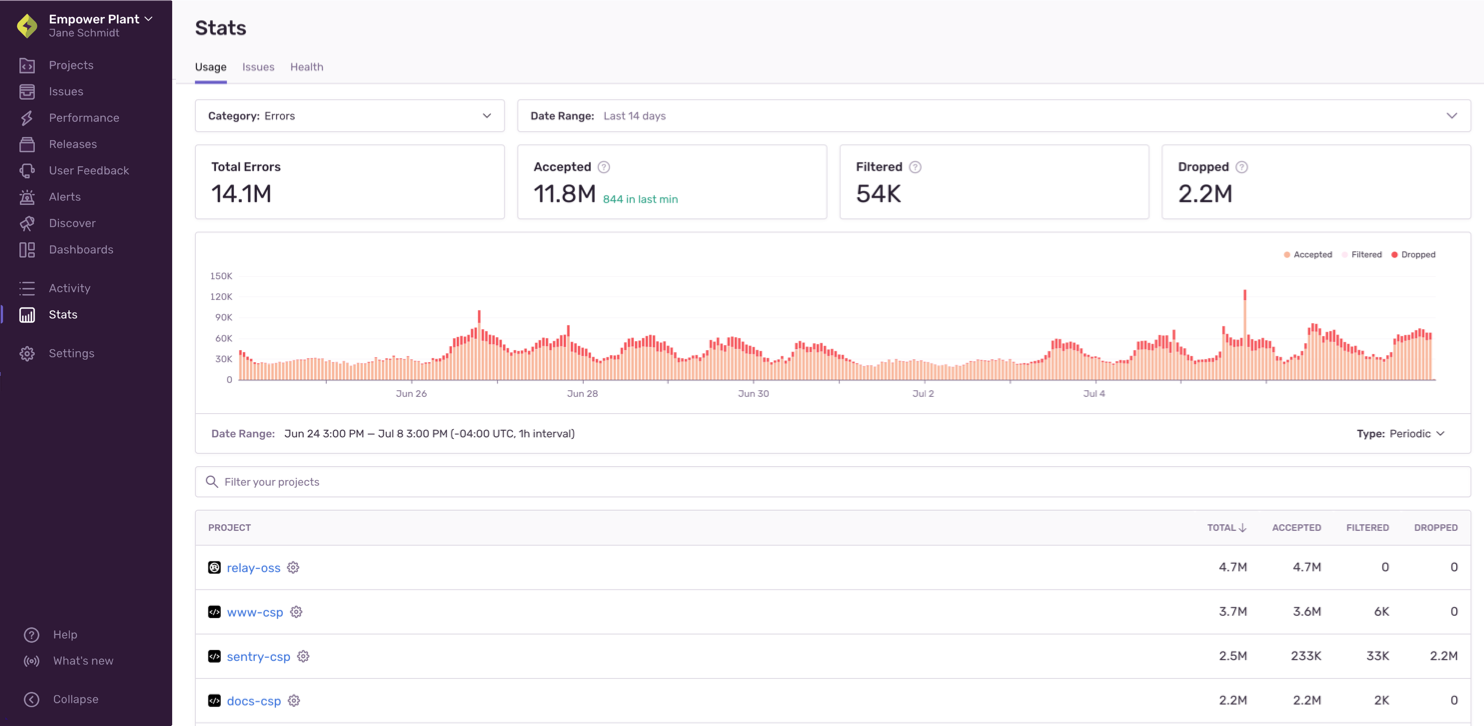
You can look at your events in aggregate in the "Usage Stats" tab of Stats. This information will help you answer key questions about the breakdown of your incoming events or which projects are consuming your quota. The answers to these questions can help you figure out where you need to do further fine-tuning of your SDK filters and configuration.
This page is accessible to all members of your organization, so Owners in your Sentry org can share this page with the developers directly responsible for a given project. Also, you can come back to this page to check if the changes you've made are having the desired effect.
The Usage Stats tab displays details about the total amount of data Sentry has received across your entire organization for up to 90 days. The page breaks down the events (by project) into three categories: accepted, dropped, or filtered. Only accepted events affect your quota:
The "Project" table in the "Usage Stats" tab of Stats breaks down your data by project, so you can see which ones are consuming your quota. Clicking on the settings icon next to a project name in the table will open the project's settings page where you can manage its inbound filters and rate limits.
You can only update the columns of the Results table in Discover if your organization is on a Business plan.
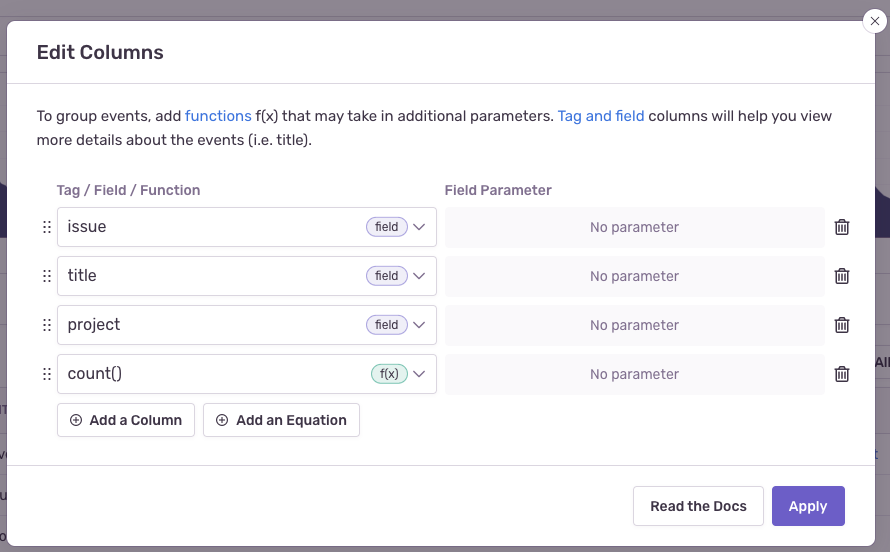
You can set up a query in Discover to take a more proactive approach to resolving your busiest issues. When you're building the query, search for event.type:error and then set the columns issue, title, project, and count(), as shown below:
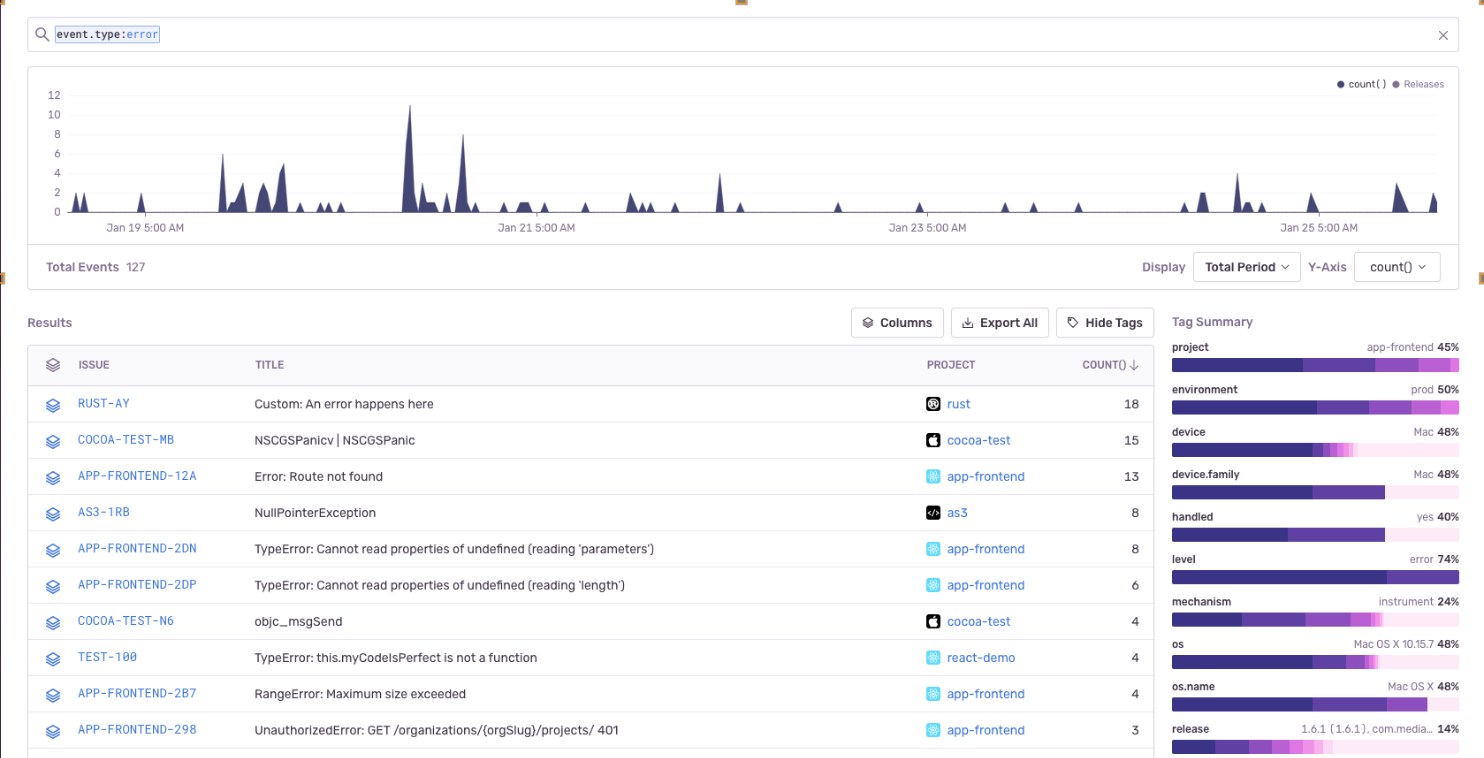
Once the changes are applied, sort the "Results" table by the "COUNT()" column to display your busiest issues:
Once you know where your quota is being used, you can start taking the steps below to control it.
All accounts have access to a one-time grace period. This means that if an account depletes its error event volume and has never previously triggered a grace period, we continue to accept events for the next three days at a maximum rate of 10,000 events per hour. If you choose not to increase your error volume, Sentry will stop accepting events for the remainder of the current billing month. However, if you increase your volume, error events accepted during the grace period will be counted as consumed volume.
While this grace period isn't dependent on the Spike Protection feature, you'll probably get a notification that you've entered a grace period along with a notification of a spike.
Spike Protection protects users from spiking event volume. Typically, spikes are caused by anomalies and have the potential to deplete your available event volume rapidly. Your baseline consumption is used to compute a threshold and spike protection is triggered if event volume exceeds this threshold. When spike protection is triggered, events start getting dropped, ensuring that you don't get charged for the excess volume.
Quotas can only be updated by a Billing or Owner member of your Sentry organization.
Once your event volume is approaching or has exceeded the quota, teammates with the "Owner" organization permission level will receive notification emails. You can then choose to increase or decrease your quota.
If this is your first time exceeding your errors quota and you're on a paid plan, you'll be entered into a one-time grace period. Learn more by reading this help article.
If you're dropping events that you want to keep because you've exceeded your quota, add to your quota at any time during your billing period by either increasing your reserved or pay-as-you-go quota.
When you exceed your quota threshold, the server will respond with a 429 HTTP status code, which communicates to SDKs and clients to stop sending events. This status code comes with a Retry-After header that indicates the time for which this rate limit is active. However, clients are not supposed to retry events, but instead drop events until the rate limit has expired, to prevent queue backlogs. Note, that since event ingestion and rate limiting happen asynchronously, the 429 HTTP status code is always slightly delayed.
To increase your quota, go to Settings > Subscription and click the "Manage Subscription" button to access your subscription options. When you increase your quota, the change goes into effect immediately.
If you're on a Developer plan and want to increase your quota, you'll need to upgrade to a Team or Business plan. On these plans you can prepay for more event volume and purchase pay-as-you-go volume, as needed. Learn about Sentry's plans on our pricing page.
If you upgrade from Team to Business mid-billing period, your pay-as-you-go pricing changes retroactively.
If the number of events you need is steadily increasing, you may want to increase your reserved capacity or volume. Reserved volume is less expensive than pay-as-you-go volume since you prepay for it. It also allows you to choose the number of events that you want to have available beforehand rather than just setting an arbitrary pay-as-you-go budget. Learn more about reserved volume in our pricing documentation.
You shouldn't increase your reserved volume if you think your need for more events is temporary, since reducing your reserved volume is tied to your billing period.
If you need to increase your event quota temporarily, we recommend that you add or increase pay-as-you-go budget. This is ideal for situations like rolling out a new version of your application where you anticipate more events for the month. Learn more about pay-as-you-go budget in our pricing documentation.
Plan downgrades and decreases in reserved volume are processed at the end of your billing period, and remaining volume cannot be refunded. For example, if you have a monthly billing period that starts on the 5th of the month, and you decrease your reserved volume on June 20th, then this change will be processed on July 4th. Your billing period beginning on July 5th will reflect your new reserved volume.
If you have an annual billing period, plan downgrades and decreases in reserved volume go into effect at the beginning of your next billing year.
Changes to pay-as-you-go volume typically go into effect immediately and are guaranteed to go into effect within 24 hours. However, you can't decrease your pay-as-you-go budget to less than what you've consumed in the current period.
To decrease your quota, go to Settings > Subscription and click "Manage Subscriptions". When you reach the "Review & Confirm" step, the date that these changes go into effect will be displayed.
We strongly recommend that you make subscription changes before the last day of your billing period. Depending on your time zone, in some cases, changes made on the last day of the billing period will not go into effect until the next billing period.
This feature is available only if your organization is on a Business or Enterprise plan.
Rate limiting allows you to set the maximum volume of error events a project key will accept during a period of time. For example, if you have a project in production that generates a lot of noise, a rate limit allows you to set the maximum amount of data, such as “500 events per minute”. Additionally, you can create a second key for the same project for your staging environment, which is unlimited, ensuring your QA process is still untouched.
In [Project] > Settings > SDK Setup > Client Keys (DSN), click "Configure", and you can create multiple DSN keys per project and assign different (or no) rate limits to each key. This will allow you to dynamically allocate keys (with varying thresholds) depending on release, environment, and so on.
Once you've set the limit, events dropped because of rate limiting generate a 429 error code.
While rate limiting is quite useful for managing your monthly event quota, keep in mind that once a defined threshold is crossed, subsequent events will be dropped. Therefore, you shouldn't constantly be hitting your rate limit; rather, it should act as a ceiling intended to protect you from unexpected spikes.
A good way to set a project rate limit is by figuring out the expected event volume based on your average traffic. Here's how to do that:
- Go [Project] > Settings > SDK Setup > Client Keys (DSN) and open the project DSN key configuration under by clicking "Configure".
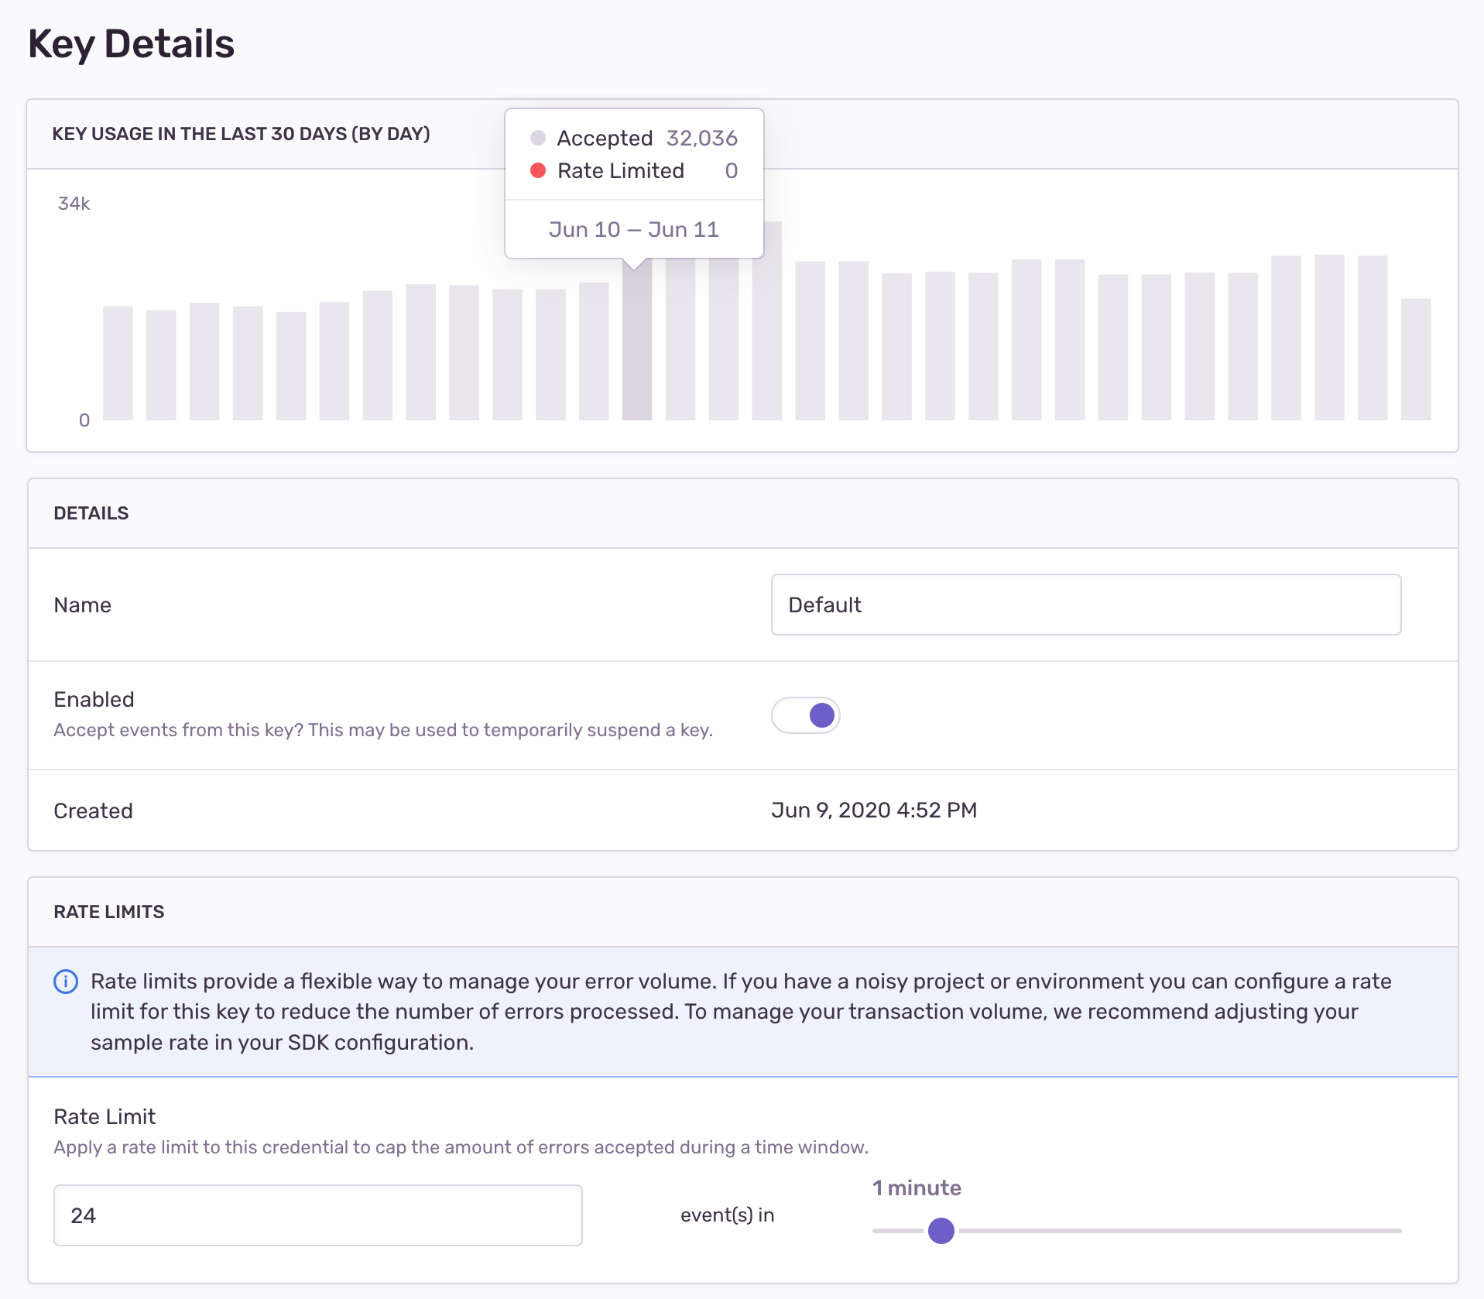
- In the "KEY USAGE IN THE LAST 30 DAYS" graph, look for the highest point, or the maximum daily rate. In the example below, the maximum daily rate in the last month is less than 34K:

- Based on the rate, choose a daily maximum value or ceiling. In this example, we calculated a daily maximum of approximately 35K, which is around 1458 events an hour, or about 24 events a minute.
- Set a daily, hourly, or minute-based rate limit. We recommend using a minute-based rate to avoid situations where a random event spike might exhaust your daily or hourly quota and leave you without event data for a long period.
You should periodically go back and check the graph to see the number of events dropped due to rate limiting and, if needed, revisit your settings.
The following rules apply for error event repetition and your quota:
- If you previously resolved an issue, a new error event counts toward your quota because it may represent a regression in your code.
- If you have chosen to ignore alerts about error events with the same fingerprint, a new event counts toward your quota because the event is still occurring.
- If you "Delete & Discard" an issue, then future error events with the same fingerprint will not count toward your quota.
This feature is available only if your organization is on a Business or Enterprise plan.
If there is an irrelevant, reoccurring issue that you are unable or unwilling to resolve, you can delete and discard it from the Issue Details page by clicking "Delete and discard future events". This will remove the issue and event data from Sentry and filter out future matching events.
You can find a list of deleted and discarded issues in the "Discarded Issues" tab in [Project] > Settings > Inbound Filters. From here, you can un-discarded any of these issues to receive future events.
Once you've identified a set of discarded issues, it might make sense to go back to your SDK configuration and add the related errors into your beforeSend client-side filtering.
While SDK configuration requires changes to your source code and depends on your next deployment, server-side filters can be easily configured per project in the "Data Filters" section of [Project] > Settings > Inbound Filters.
Once applied, you can track the filtered events (numbers and cause) using the graph provided at the top of the "Inbound Data Filters" page.
Sentry provides several methods to filter all events and attachments server-side, which are applied before checking for potential rate limits. Inbound filters include:
- Common browser extension errors
- Events coming from
localhost - Known legacy browsers errors
- Known web crawlers
- Error messages
- Specific release versions of your code
- Certain IP addresses
The first four options above are settings that you simply toggle on or off. Setting the others is explained further below.
After these checks are processed, events and attachments that aren't dropped based on these filters count toward your quota. They're accepted into Sentry, where they're persisted and stored.
If you have a rogue client, Sentry supports blocking an IP from sending data. Navigate to [Project] > Settings > Inbound Filters to add the IP addresses (or subnets) in the "IP Addresses" field.
This feature is available only if your organization is on a Business or Enterprise plan.
If you discover a problematic release causing excessive noise, Sentry supports ignoring all events and attachments from that release. Navigate to [Project] > Settings > Inbound Filters, then add the release to the "Releases" field.
This feature is available only if your organization is on a Business or Enterprise plan.
Sentry supports filtering out a specific or certain kind of error as well. Navigate to [Project] > Settings > Inbound Filters, then add the error message to the "Error Message" field.
To ensure you’re adding the correct message to the inbound filter setting, check the JSON for an event in the issue. The filter by error message setting matches the data found in the title field near the end of the file.
If a sample rate is defined for the SDK, the SDK evaluates whether this event should be sent as a representative fraction of events. Setting a sample rate is documented for each SDK.
The SDK sample rate is not dynamic; changing it requires re-deployment. Also, keep in mind that setting an SDK sample rate limits visibility into the source of events. Setting a rate limit for your project may better suit your needs.
All Sentry SDKs support the beforeSend callback method. Once implemented, the method is invoked when the SDK captures an error event, right before sending it to your Sentry account. It receives the event object as a parameter, so you can use that to modify the event's data or drop it completely (by returning null) based on your custom logic and the data available on the event, like tags, environment, release version, error attributes, and so on. Note that only error and message events pass through beforeSend. Tansaction events have a separate method, beforeSendTransaction, though it's not yet supported in all SDKs. Learn more about both methods in Filtering Events.
The Sentry SDKs have several configuration options that can be used to filter unwanted errors from leaving your application's runtime. A lot of these options are platform-specific, so make sure you look for yours in our platform docs under Configuration. Following are some configuration examples for JavaScript and other SDKs.
The JavaScript SDK includes multiple integrations: functional plugins that you can configure, enable, or disable. Learn more in JavaScript SDK Integrations. Several integrations allow you to configure the types of events you want Sentry to monitor; two of them, InboundFilters and GlobalHandlers are explained below:
The integration is enabled by default and adds the following configuration options to the SDK:
allowUrls: Domains that might raise acceptable exceptions represented in a regex pattern format.denyUrls: A list of strings or regex patterns which match error URLs that should be blocked from sending events. Configuring bothallowUrlsanddenyUrlson the SDK can be used to block subdomains of the domains listed inallowUrls.ignoreErrors: Instructs the SDK to never send an error to Sentry if it matches any of the listed error messages or regular expressions. The SDK will try to match against the message or, if there is no message, a string containing the exception type and value formatted like so:ExceptionType: value.ignoreTransactions: Instructs the SDK to never send a transaction to Sentry if it matches any of the listed transaction names or regular expressions.
To learn more and see code samples, check out:
This integration attaches global handlers to capture uncaught exceptions (onerror) and unhandled rejections (onunhandledrejection). Both handlers are enabled by default, but can be disabled through configuration. Learn more in GlobalHandlers Integration.
Check out additional configuration options with the BrowserApiErrors and ReportingObserver integrations.
Java - Sentry's Java SDK provides integrations with common Java logging libraries. The configuration allows you to set a logging threshold determining the minimum level to capture a log message as breadcrumb. It also provides a setting to configure the minimum log level to capture an event.
PHP - The error_types configuration option allows you to set the error types you want Sentry to monitor. Learn more in PHP Basic Options.
Ruby - The excluded_exceptions configuration option allows you to set the exception types you wish to suppress. Learn more in the Ruby configuration docs
Our documentation is open source and available on GitHub. Your contributions are welcome, whether fixing a typo (drat!) or suggesting an update ("yeah, this would be better").


