Source Context
Learn about setting up source bundles to show source code in stack traces on the Issue Details page.
If Sentry has access to your application's source code, it can show snippets of code (source context) around the location of stack frames, which helps to quickly pinpoint problematic code.
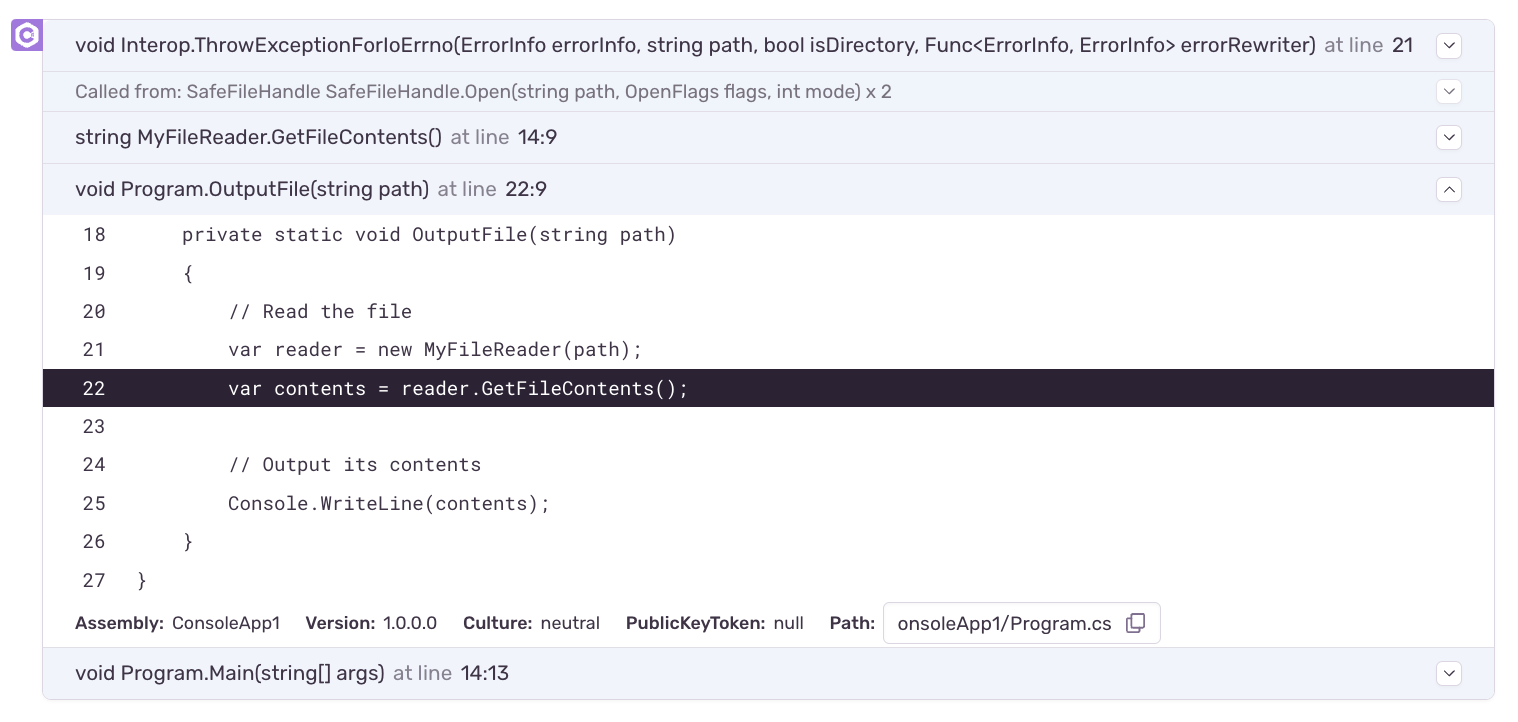
For example, here's a stack trace from a .NET application. The source context contains the original C# source code of the application, with the location of the frame highlighted.
Certain SDKs, such as the Python SDK, can resolve this source context automatically, because they have access to unobfuscated source code at runtime. By contrast, to get source context for compiled applications, the source code needs to be uploaded alongside the debug information files. The recommended way to do this is by using sentry-cli. See Creating Source Bundles for more information.
After they've been uploaded you can review and manage source bundles the same as any other debug information file. See Managing Debug Information Files. Source bundles will be tagged with sources, and will carry the same filename as the respective debug information file they were created from.
Our documentation is open source and available on GitHub. Your contributions are welcome, whether fixing a typo (drat!) or suggesting an update ("yeah, this would be better").
