Set Up Crons
Sentry Crons allows you to monitor the uptime and performance of any scheduled, recurring job in your application.
Once implemented, it'll allow you to get alerts and metrics to help you solve errors, detect timeouts, and prevent disruptions to your service.
- Use our getting started guide to install and configure the Sentry Java SDK (min 6.30.0) for your recurring job.
- Ensure that
org.aspectj.aspectjweaveris present as a dependency of your project.
- Create and configure your first Monitor.
If you are using Quartz, please see our Quartz integration. You may also send check-ins manually.
Check-in monitoring allows you to track a job's progress by completing two check-ins: one at the start of your job and another at the end of your job. This two-step process allows Sentry to notify you if your job didn't start when expected (missed) or if it exceeded its maximum runtime (failed). To start sending check-ins simply add the @SentryCheckIn("<monitor-slug>") annotation to the method you want to send check-ins for.
import io.sentry.spring.jakarta.checkin.SentryCheckIn;

@Component
public class CustomJob {

  @Scheduled(fixedRate = 3 * 60 * 1000L)
  @SentryCheckIn("<monitor-slug>") // 👈
  void execute() throws InterruptedException {
    // your task code
  }
}
Heartbeat monitoring notifies Sentry of a job's status through one check-in. This setup will only notify you if your job didn't start when expected (missed). If you need to track a job to see if it exceeded its maximum runtime (failed), use check-ins instead. To start sending heartbeats simply add the @SentryCheckIn(monitorSlug = "<monitor-slug>", heartbeat = true) annotation to the method you want to send heartbeats for.
import io.sentry.spring.jakarta.checkin.SentryCheckIn;

@Component
public class CustomJob {

  @Scheduled(fixedRate = 3 * 60 * 1000L)
  @SentryCheckIn(monitorSlug = "<monitor-slug>", heartbeat = true) // 👈
  void execute() throws InterruptedException {
    // your task code
  }
}
When your recurring job fails to check in (missed), runs beyond its configured maximum runtime (failed), or manually reports a failure, Sentry will create an error event with a tag to your monitor.
To receive alerts about these events:
- Navigate to Alerts in the sidebar.
- Create a new alert and select "Issues" under "Errors" as the alert type.
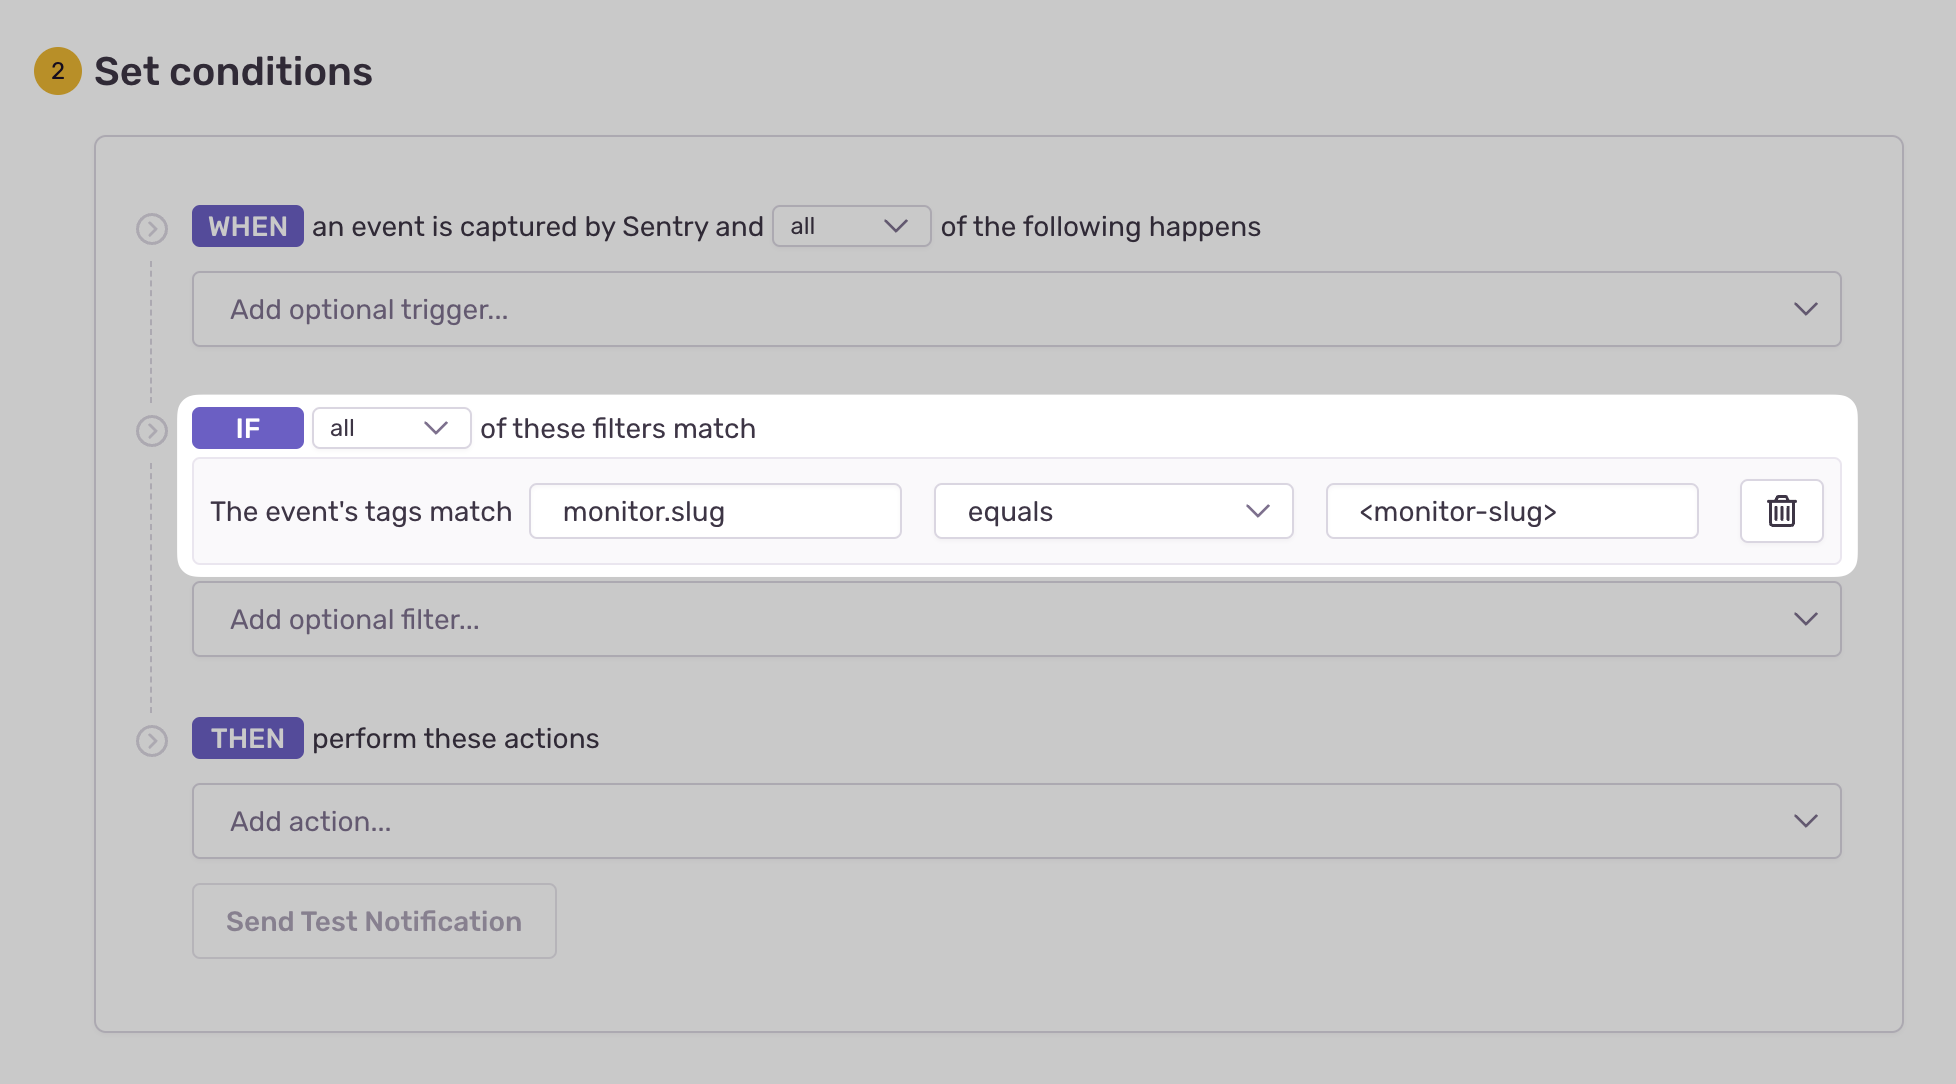
- Configure your alert and define a filter match to use:
The event's tags match {key} {match} {value}.
Example: The event's tags match monitor.slug equals my-monitor-slug-here
Learn more in Issue Alert Configuration.
Crons imposes a rate limit on check-ins to prevent abuse and resource overuse. Specifically, you can only send a maximum of 6 check-ins per minute per existing monitor environment. This limit is enforced on a per-project basis, meaning that the rate limit applies collectively to all monitor environments within a given project. You can check if any of your check-ins are being dropped in the Usage Stats page.
To avoid dropped check-ins, it is crucial to manage and distribute your check-ins efficiently within the rate limits. This will help maintain accurate monitoring and ensure that all critical check-ins are captured and processed.
Our documentation is open source and available on GitHub. Your contributions are welcome, whether fixing a typo (drat!) or suggesting an update ("yeah, this would be better").
