Replay Details
Learn more about how information is organized on the Replay Details page and how to share and delete replays.
If you have any questions, feedback or would like to report a bug, please open a GitHub issue with a link to a relevant replay or, if possible, a publicly accessible URL to the page you're attempting to record a replay of.
Every replay has a detailed view that contains the embedded video player and rich debugging context. Playing back the video will allow you to see every user interaction in relation to console messages, DOM events, and network requests. It’s like having DevTools active for your production user sessions. Almost every component on this page is connected through timestamps. See the breakdown of each component and why it’s valuable:
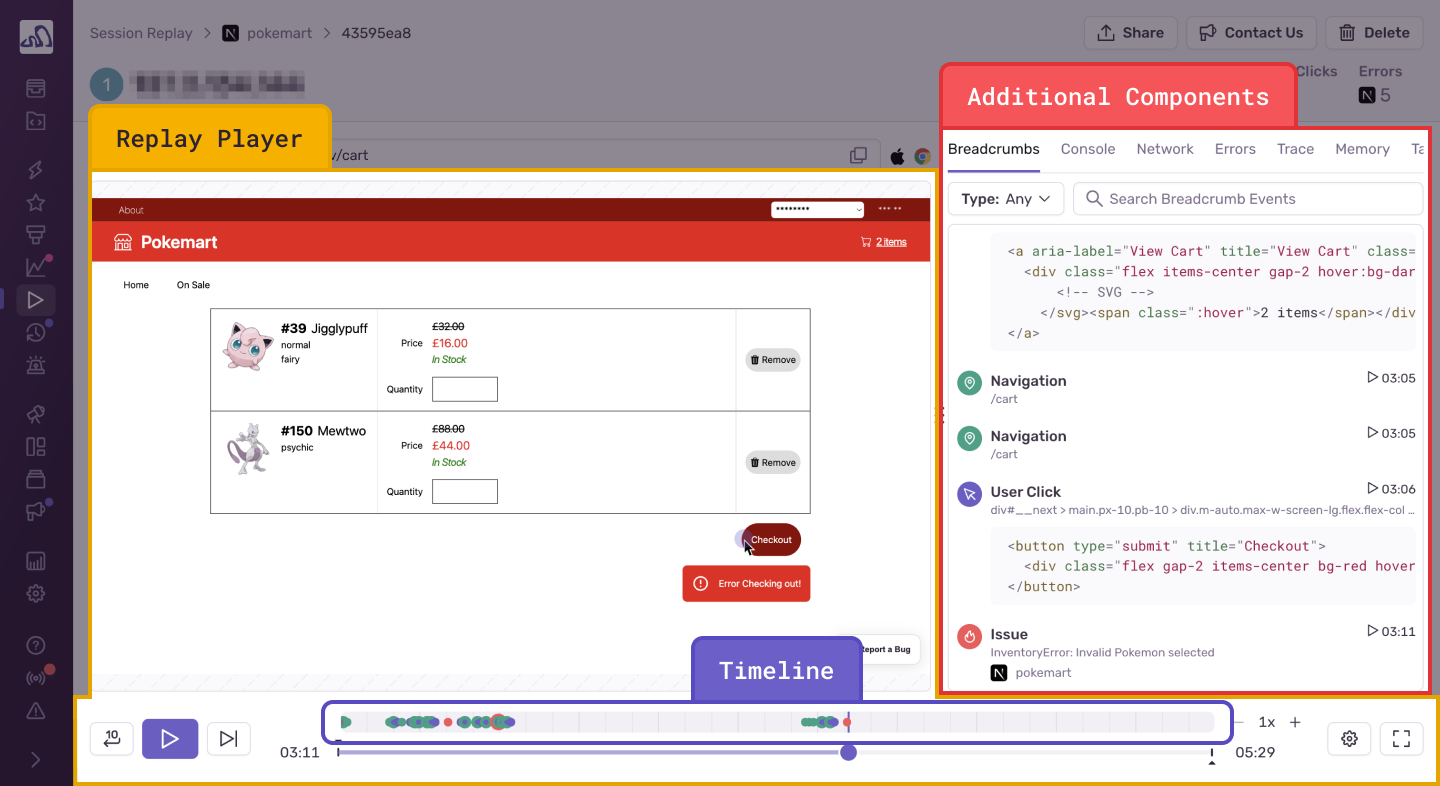
- Replay Player: Video-like reproduction of a user session created from DOM snapshots. This is where you can visualize exactly what actions the user took during a user session, and how the website behaved within this specific user’s environment, including browser, latency, settings, and so on. Most importantly, you can see which actions lead to an error and take the guesswork out of debugging.
- By default, the Session Replay SDK is configured to replace all text nodes and user input with asterisks (*), and to remove media elements. See all privacy configuration options here.
- Breadcrumbs: The replay breadcrumbs show when key user interactions took place, specifically: user clicks (including rage and dead clicks), user inputs, page navigations, page loads, as well as custom breadcrumbs set by the organization and Web Vitals. Web Vitals are augmented with the selector to help users identify which elements are affecting their Web Vital scores. User clicks (including rage and dead clicks), are augmented with surrounding HTML source code to help users understand which event was targeted. These breadcrumbs are synced with the replay player and will auto-scroll as the video plays.
- Some breadcrumb types visible in Issue Details are not 1:1 to the replay breadcrumbs list. The trail of events typically seen in the Issue Details page are now displayed in the Console and Network components of the Replay Details page.
- To learn more about how custom breadcrumbs are rendered, read the docs here.
- Timeline: This is the section at the bottom of the Replay Details page that illustrates where significant events (such as errors, rage clicks, and user interactions) happen over the course of the replay. This allows users to easily scrub to key events by dragging across the timeline. It also visually conveys the amount of time that took place between events and has a zoom functionality so you can easily zoom-in to distinguish between events that happen close together.
- Console: A list of all messages that were emitted to the web console. This includes debugging information included in the web application, as well as browser-generated messages to the developer. As the video plays, there’s a visual indicator that tracks through the table of console messages, highlighting which messages happened prior to, or next to this point in the video. You can also click the timestamp on the far right of the console message to bring yourself to that point in the replay player.
Network: A list of all network requests that were initiated by the page while the replay recording was active. As the video plays, there’s a visual indicator that tracks through the table of network requests, highlighting which requests happened prior to, or next to this point in the video. You can also click the timestamp on the far right of each request to bring yourself to that point in the replay player. If configured, Sentry can also show the actual HTTP request body and headers.
Errors: See all the errors that occurred in the replay, with links to the corresponding events and issue(s), and the impact these issues have had holistically across all users on your application.
Trace: Connects all the trace(s) that happened during the replay.
- Due to transaction sampling, this view may be missing traces.
Memory: The view shows a heap size chart displaying the total amount of memory being used by JavaScript objects.
- This view is only available when the replay was recorded on a Chromium-based browser.
Share a replay at a specific timestamp with a Sentry member by clicking the “Share” button in the top-right corner of the Replay Details page. This allows you to share replays at the point of a critical event or user flow with other Sentry members in your organization.
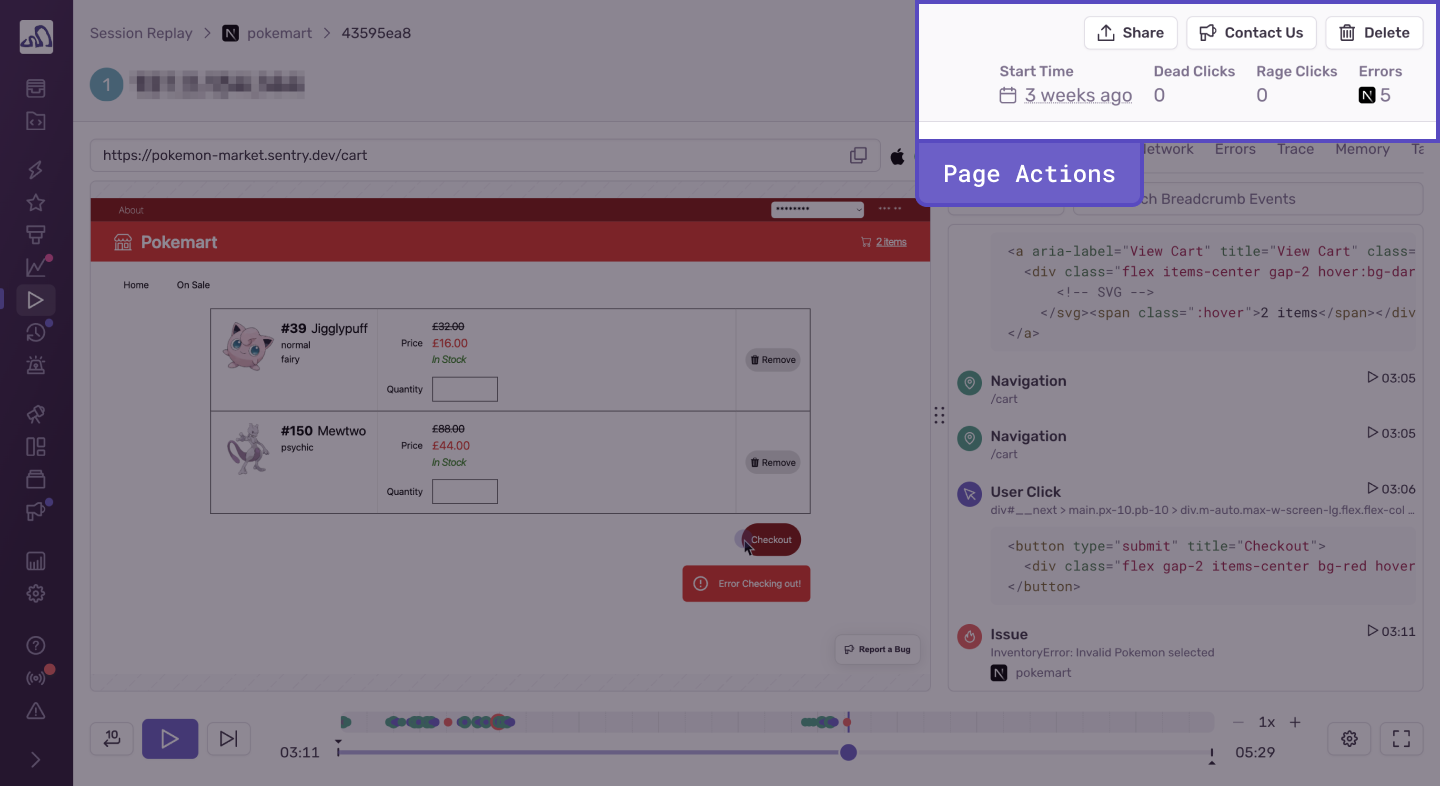
Delete an individual replay by clicking the “Delete” button in the top-right corner of the Replay Details page. You can’t delete replays that are in-progress. Please note that deleting replays do not affect your quota.
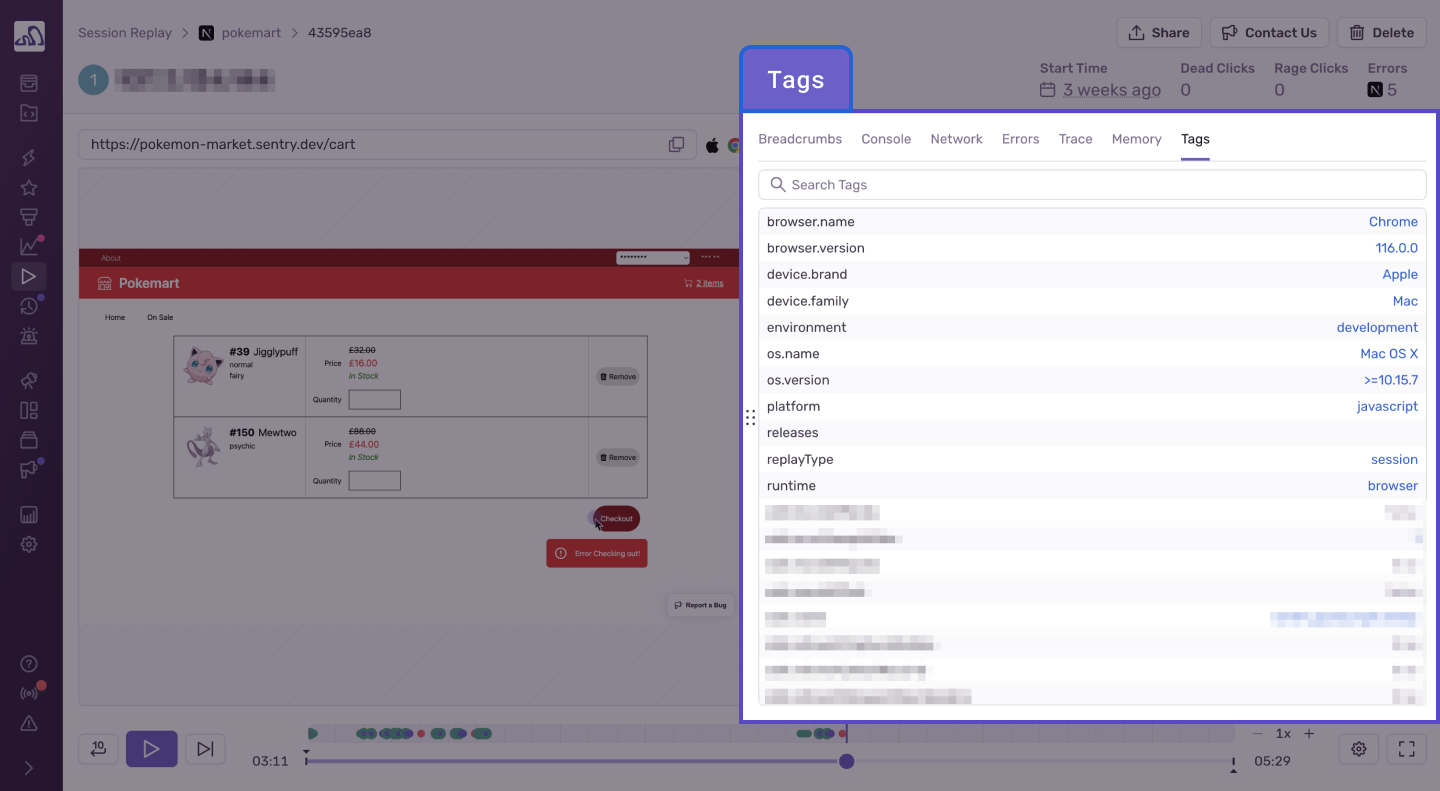
Find a complete list of built-in fields and custom tags associated with a replay under the “Tags” tab next to Breadcrumbs for additional context around the replay you’re viewing.
Replays are retained for 90 days in sentry.io for paid plans (the same retention period as other event types, such as Errors and Transactions). For free plans, replays are retained for 30 days in sentry.io. The retention period is not configurable.
If you've chosen not to capture certain errors by applying any of the below inbound filter rules, those same rules will also apply to Session Replays.
- IP Addresses
- Releases
- Request URLs
- User-Agents
Note: Because filtered outcomes are emitted per segment whereas successful outcomes are emitted per replay (a replay being a collection of segments), you may see a noticeable increase in filtered outcomes on your Stats page. This is not an error.
Our documentation is open source and available on GitHub. Your contributions are welcome, whether fixing a typo (drat!) or suggesting an update ("yeah, this would be better").