Profiling Metrics
Learn about the measurements taken by the Sentry profiler that help us contextualize the work your mobile app does and detect possible issues impacting performance.
The Sentry profiler records several system measurements to help analyze the backtraces it gathers. Some, like CPU and heap usage, are taken on a regular sampling interval using functions from mach/mach.h, albeit with a lower frequency than backtrace sampling. Others, like GPU information, are taken from CADisplayLink callback invocations, as they're received.
The amount of CPU used by the app process, (as a scaled percentage of total CPU capacity, which varies depending on the number of cores), is measured every 100 ms. The value is calculated using thread_info with THREAD_BASIC_INFO, which returns a CPU usage value per thread and sums up the values for all current threads.
The amount of heap memory used by the application is recorded every 100 ms using task_info with TASK_VM_INFO.
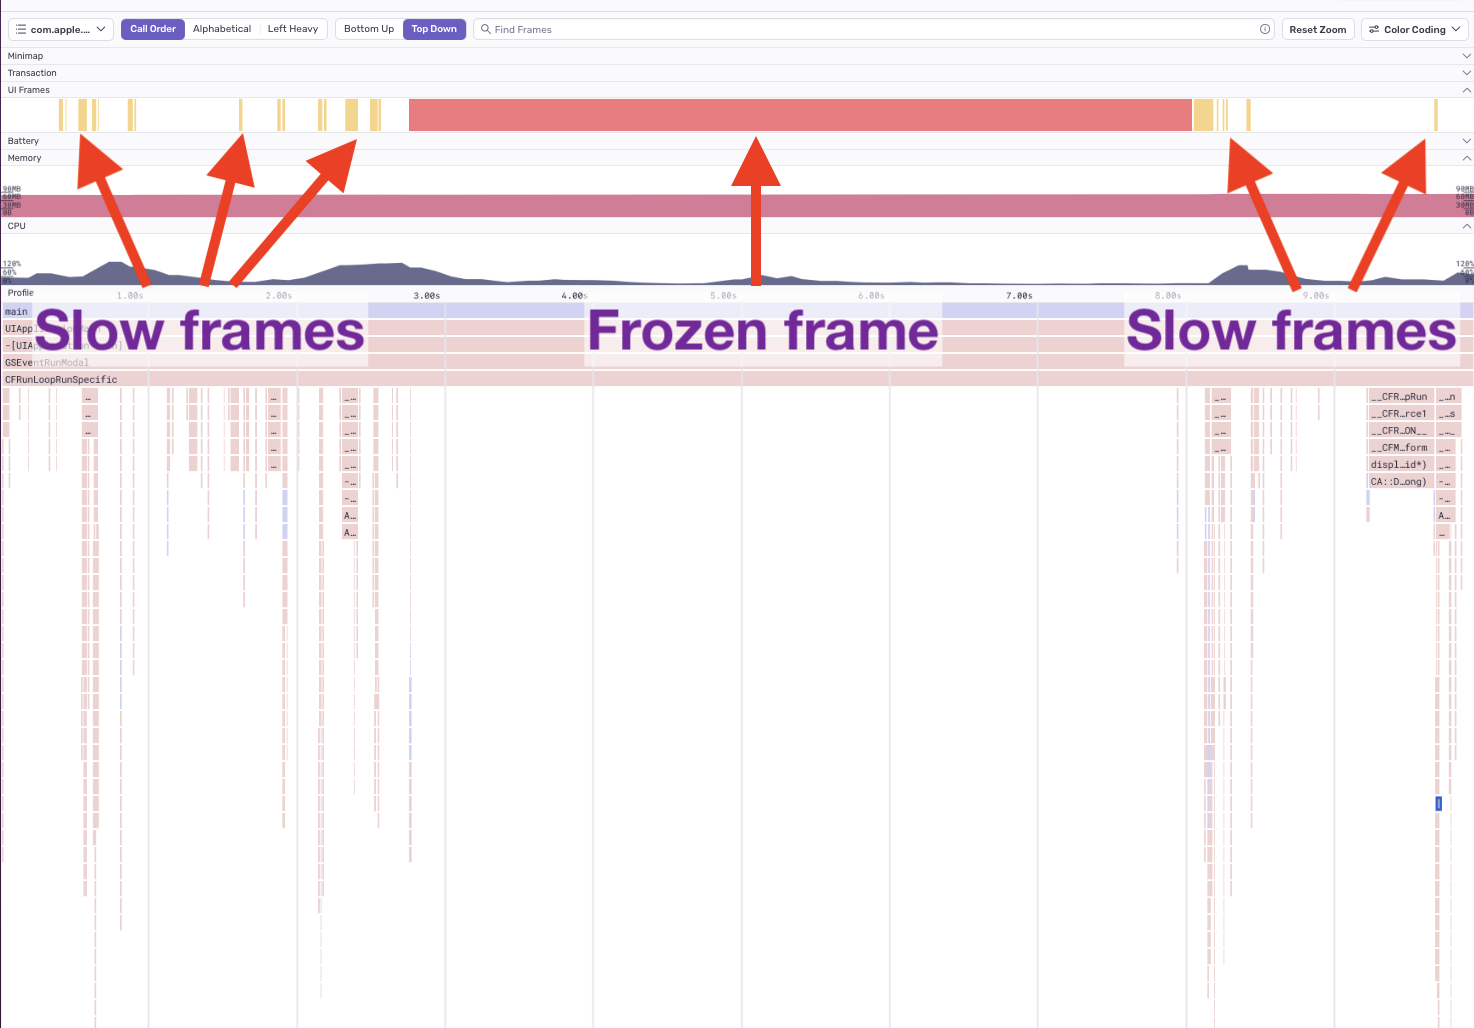
In addition to counting the number of slow and frozen UI frame renders for Mobile Vitals, Sentry now records the timestamp for every frame and overlays it on top of profiling flame charts:
The profiler records the current frame rate upon start, and then any time it changes, (for example if a user puts their device into low-power mode).
The amount of energy expended by CPU work allocated to the app process is calculated every 100 ms using task_info with TASK_POWER_INFO_V2.
Our documentation is open source and available on GitHub. Your contributions are welcome, whether fixing a typo (drat!) or suggesting an update ("yeah, this would be better").
