Flame Graphs and Aggregated Flame Graphs
Learn more about how to interpret flame graphs and aggregated flame graphs.
Profiling data can be used to gain insight into what methods and lines of your code are slow. But getting this type of insight requires an understanding of how profiling data is represented and visualized. Sentry uses both flame graphs and aggregated flame graphs to visualize profile data. We'll explain how to read them below.
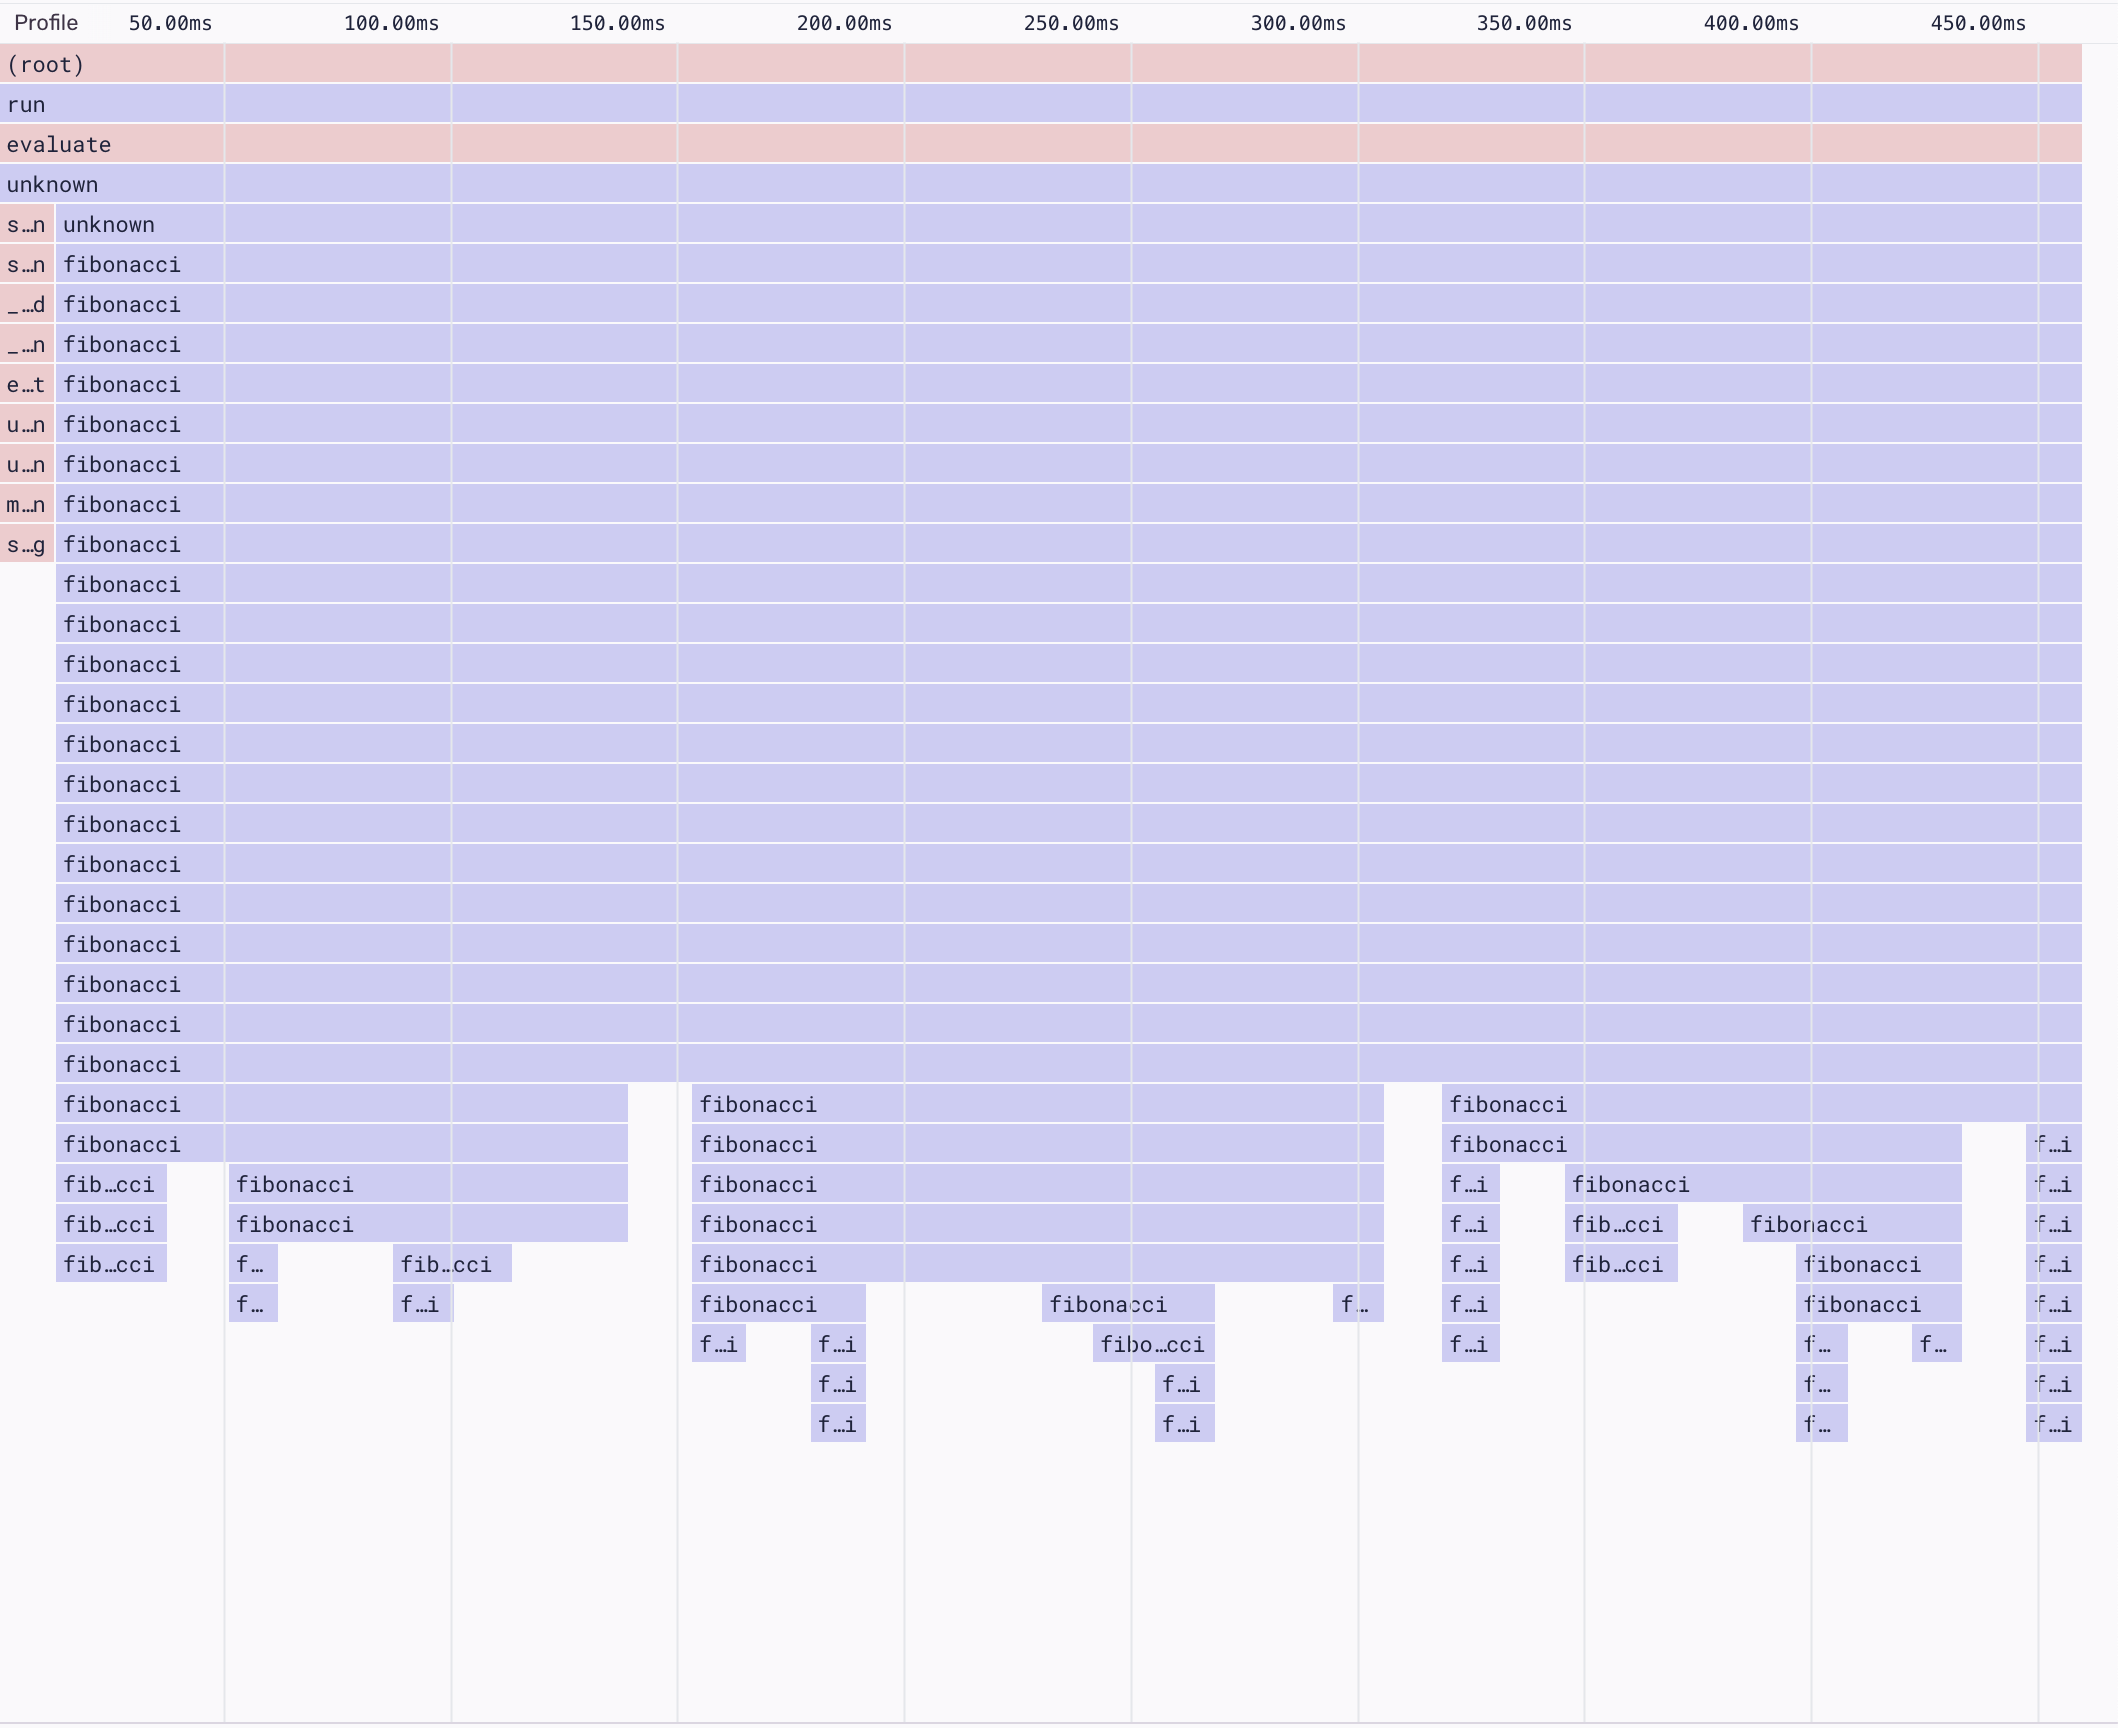
Flame graphs show stack samples in chronological order over the duration of a single profile. Each rectangle in the visualization represents a stack frame. The X-axis on a flame graph represents time, while the Y-axis shows the execution stack at that time. This makes it possible to see what your program was executing at any given point while the profile was being collected.
The most important things to look at when interpreting flame graphs are the color and width of the rectangle representing each frame on the stack.
Color schemes vary, but by default in Sentry, system functions are colored red, and application functions are blue.
If your code is slow because of red system frames, there's usually not much you can do to speed it up. However, you can influence the execution of any blue application frames in your code.
As an example, consider a function called readFile that reads a file from the disk. While you can't modify the underlying kernel open() system call that's called, you can change your application code to only call that function once, and reuse the file contents afterward. This would reduce disk I/O (a common performance bottleneck).
The width of each stack frame's rectangle represents the time spent in that function. By looking at a flame graph, we can see two key pieces of information: function total time and function self-time.
Function total time refers to how long it takes for a function and all of its children to execute. Function self-time refers to how much time the function itself takes to execute, excluding the time spent in child functions.
Let's look at an example to understand the difference.
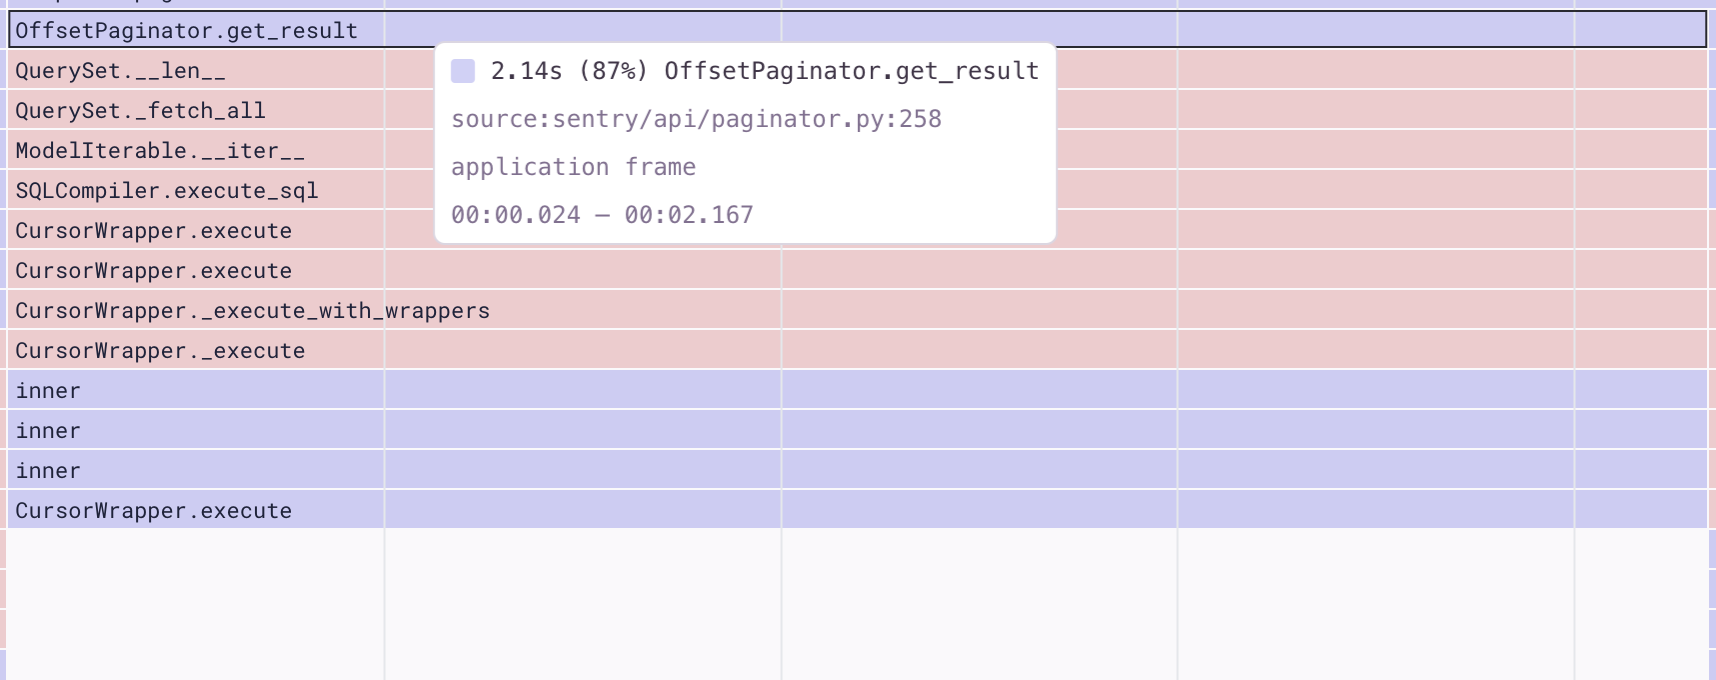
This image shows a section of a flame graph, starting with the function OffsetPaginator.get_result, which takes 2.14s to execute. 2.14s is the function's total time. Looking further down the stack, you can see that nearly the full 2.14s is taken up by the child function, CursorWrapper.execute, which executes a slow database query.
In this example, the self-time of the parent function, OffsetPaginator.get_result, is close to 0ms while both the self-time and the total time of CursorWrapper.execute are nearly 2.14.
While flame graphs are used to represent stack samples of a single profile in chronological order, aggregated flame graphs represent stack populations of your profiled program. They optimize for merging stacks to display aggregate function durations.
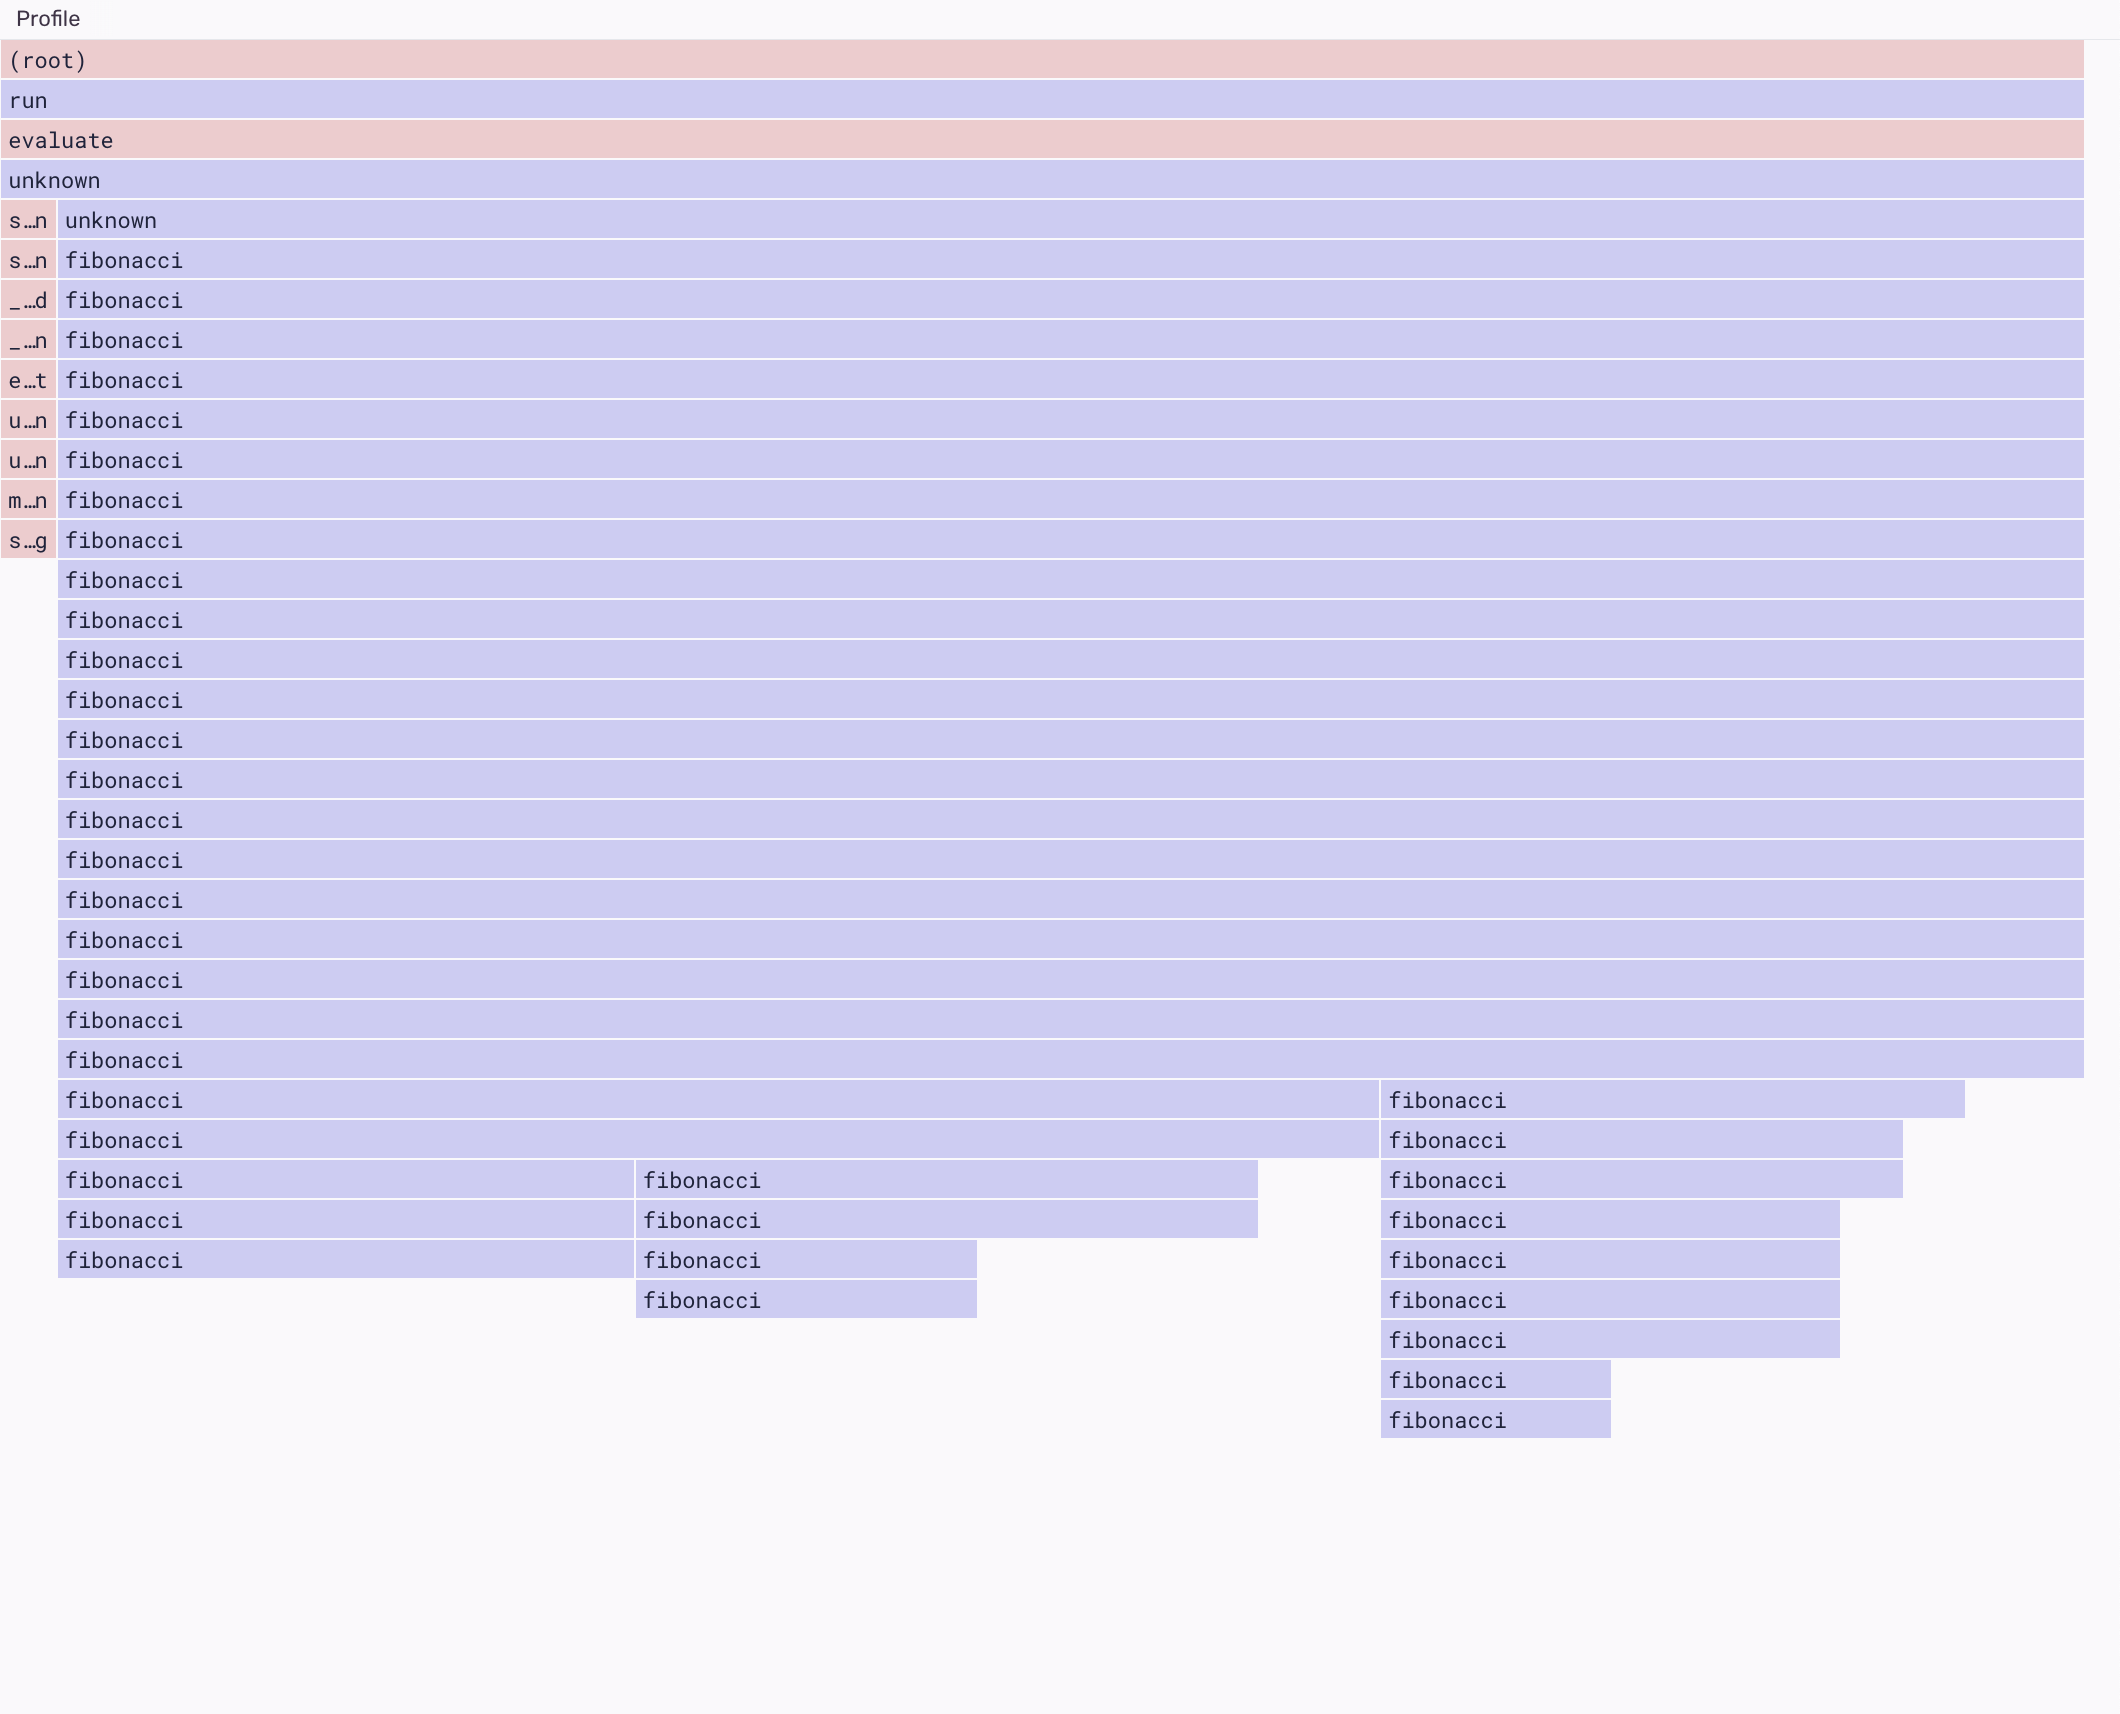
As with flame graphs, each rectangle represents a stack frame, but in aggregated flame graphs, the X-axis doesn't represent time, instead, it shows all the stack profiles, sorted alphabetically. The wider a frame is, the more often it was present in a stack.
Aggregating stacks this way helps you find performance optimizations by visualizing the code that most frequently occupies your program's call stack.
The same profile data, visualized in a aggregated flame graph on top and a flame graph on the bottom.
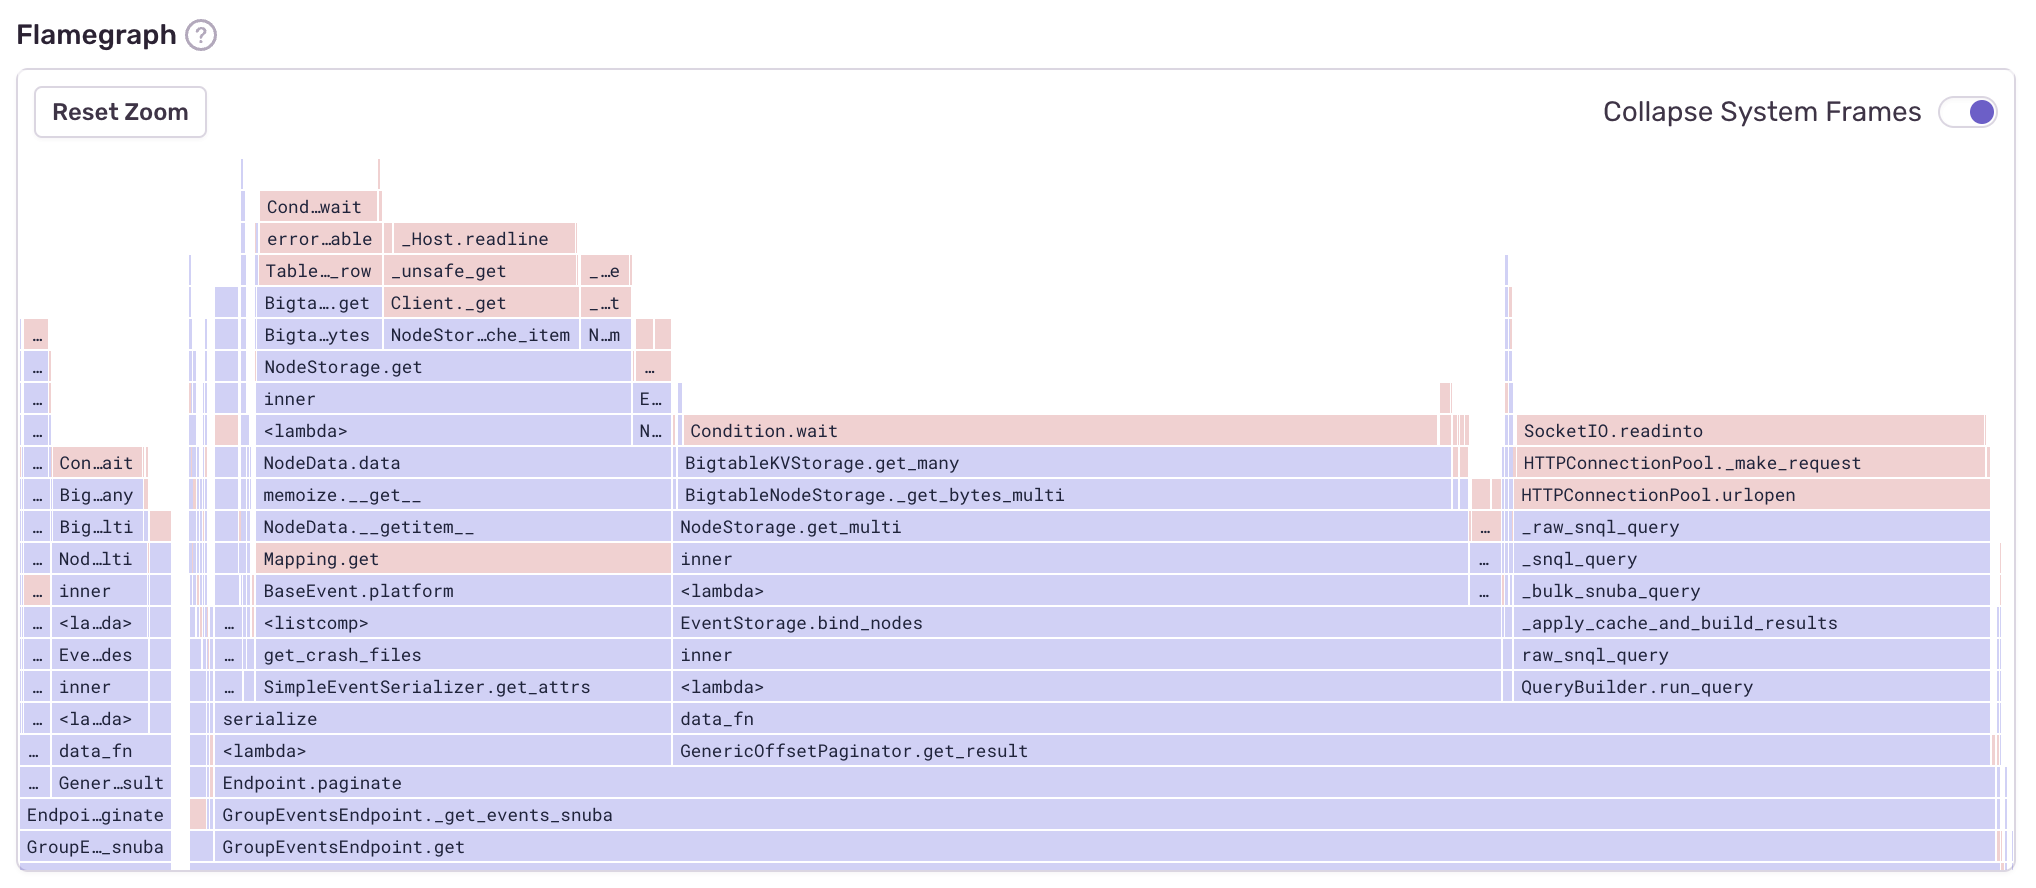
The first aggregated flame graph above is shown "flames down", and the second aggregated flame graph is shown "flames up". Whether you choose to look at a aggregated flame graph in a flames up or a flames down view is a matter of personal preference. The information is identical.
In sentry.io, aggregated flame graphs are displayed on your profile summary page. The aggregated flame graphs on this page are created using data from many different profiles so that you can see the most common performance bottlenecks in your program.
Our documentation is open source and available on GitHub. Your contributions are welcome, whether fixing a typo (drat!) or suggesting an update ("yeah, this would be better").


