Automatic Instrumentation
Learn what transactions are captured after tracing is enabled.
Once you set up tracing, the SDK enables the following features by default:
- UIViewController Tracing
- App Start Tracing
- Slow and Frozen Frames
- Network Tracking
- File I/O Tracing
- Core Data Tracing
- User Interaction Tracing
This feature is available for iOS, tvOS, and Mac Catalyst, is enabled by default, and works for UIViewControllers.
UIViewController Tracing is enabled by default once you set up tracing. This feature captures transactions when your app loads an in-app UIViewController. However, the SDK doesn't capture transactions for UIViewControllers of third-party libraries or SwiftUI. The SDK sets the transaction name to the name of the ViewController, including the module — for example, Your_App.MainViewController — and the transaction operation to ui.load.
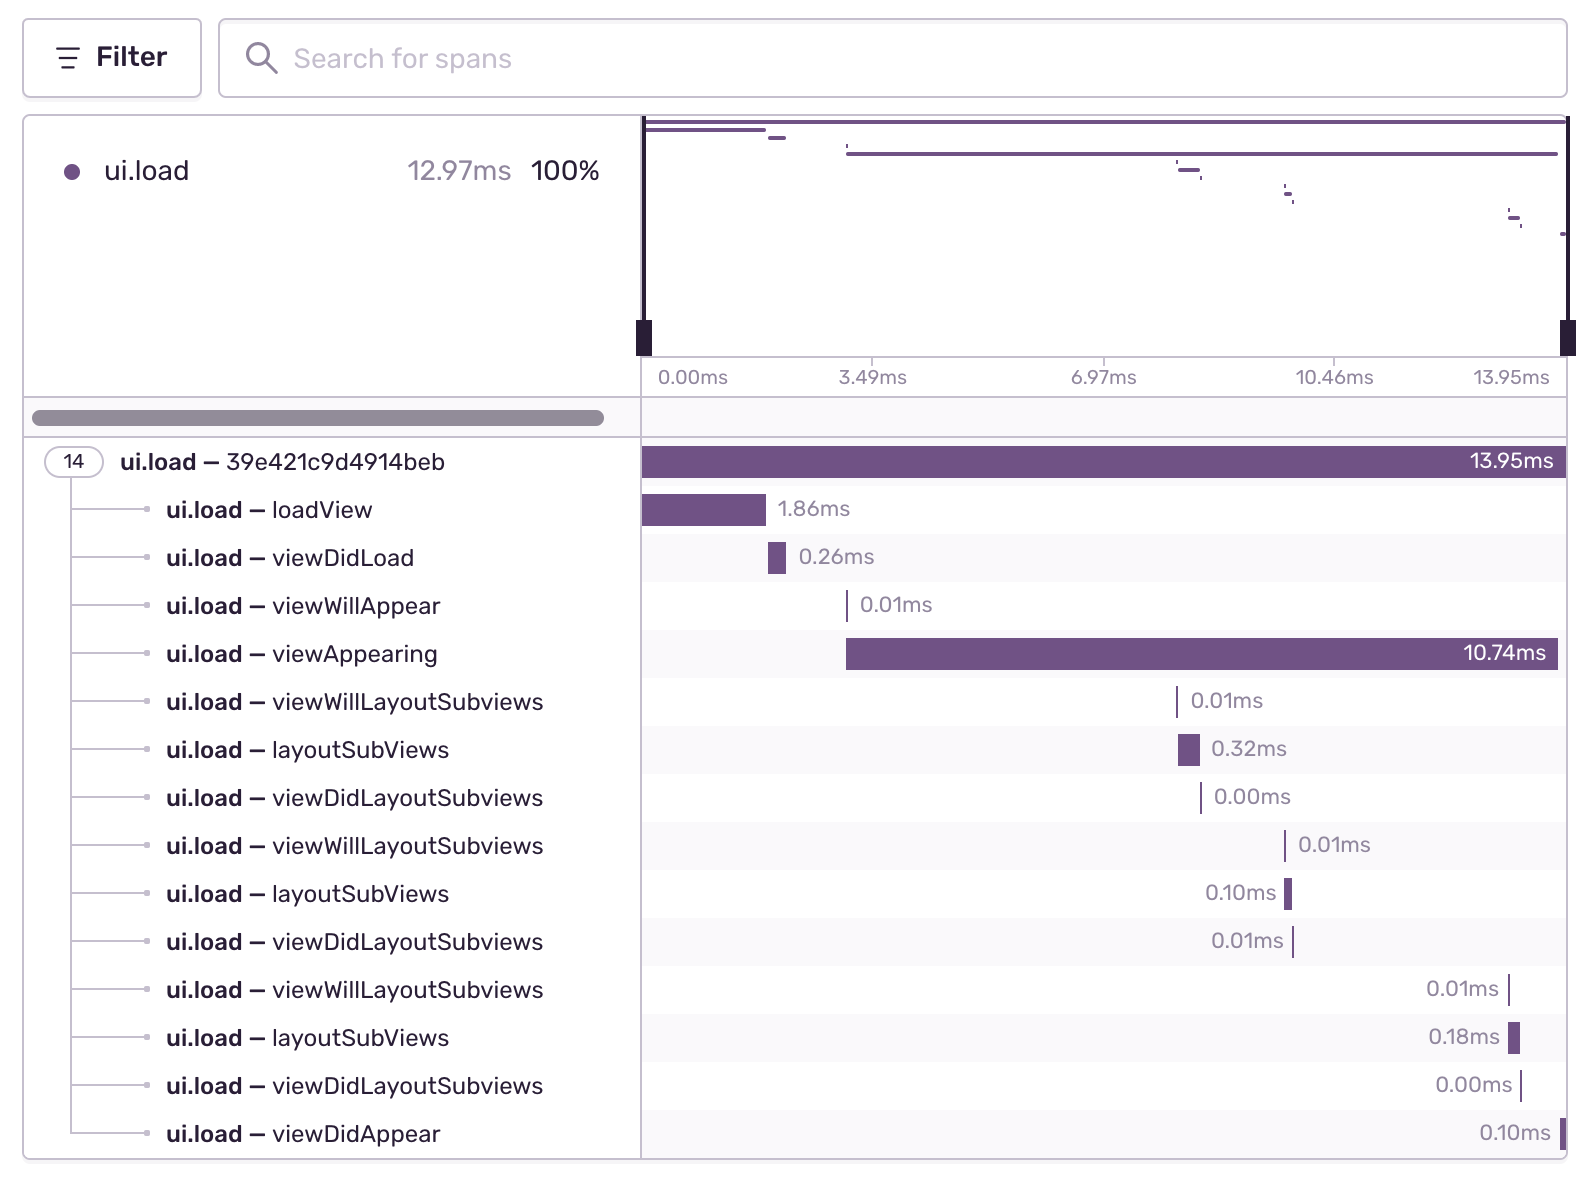
The SDK creates spans to provide insight into the time consumed by each of the methods shown in the screenshot below. Due to implementation limitations, the SDK only adds a span for loadView if the instrumented view controller implements it. The SDK adds spans for all other methods, whether you implement them in your view controller or not.
The SDK sets up a parent-child relationship for nested UIViewControllers, starting with the first UIViewController that your app loads. If there's no active transaction on the scope, the SDK will start a new UIViewController transaction and bind it to the scope unless there's a user interaction transaction already on the scope, in which case this will be closed and removed first.
While a UIViewController transaction is active on the scope, the SDK will add any new UIViewController spans as child spans of that active transaction. This creates a unified view of all UIViewControllers on a screen in a single transaction.
If another transaction is already bound to the scope (if it's been set manually, for example) the SDK won't be able to bind a new UIViewController transaction to the scope. This means that the new transaction will work, but won’t capture other auto-generated spans, like HTTP, file IO, or Core Data, which can only be added to transactions that are bound to the scope.
To disable the UIViewController Tracing:
import Sentry
SentrySDK.start { options in
options.dsn = "https://examplePublicKey@o0.ingest.sentry.io/0"
options.enableUIViewControllerTracing = false
// Before 8.0.0
options.enableUIViewControllerTracking = false
}
You can deactivate tracing for specific UIViewControllers by configuring swizzleClassNameExcludes:
import Sentry

SentrySDK.start { options in
    options.swizzleClassNameExcludes = [
      "MyUIViewController",
    ]
}
This feature is available for iOS, tvOS, and Mac Catalyst.
App Start Tracing is enabled by default once you set up tracing. This feature provides insight into how long your application takes to launch. It adds spans for different phases, from the application launch to the first auto-generated UI transaction.
The SDK adds these spans to the first transaction that starts during the app launch with the operation ui.load. This is what UIViewController tracing uses. If the duration between the transaction start time and the end timestamp of the app start is more than 5 seconds, the SDK doesn't attach the spans from the app start. This helps prevent attaching spans to unrelated transactions. To enable this feature, enable enableAutoPerformanceTracing.
The SDK differentiates between a cold and a warm start, but doesn't track hot starts/resumes.
- Cold start: App launched for the first time, after a reboot or update. The app is not in memory and no process exists.
- Warm start: App launched at least once, is partially in memory, and no process exists.
Sentry's App Start instrumentation aims to be as comprehensive and representative of the user experience as possible, and adheres to guidelines by the platform vendors. For this reason, App Starts reported by Sentry might be longer than what you see in other tools.
For example, Sentry measures the duration from process start, including the time before before runtime initialization and before the first application object is loaded, until the first frame is rendered to the user.
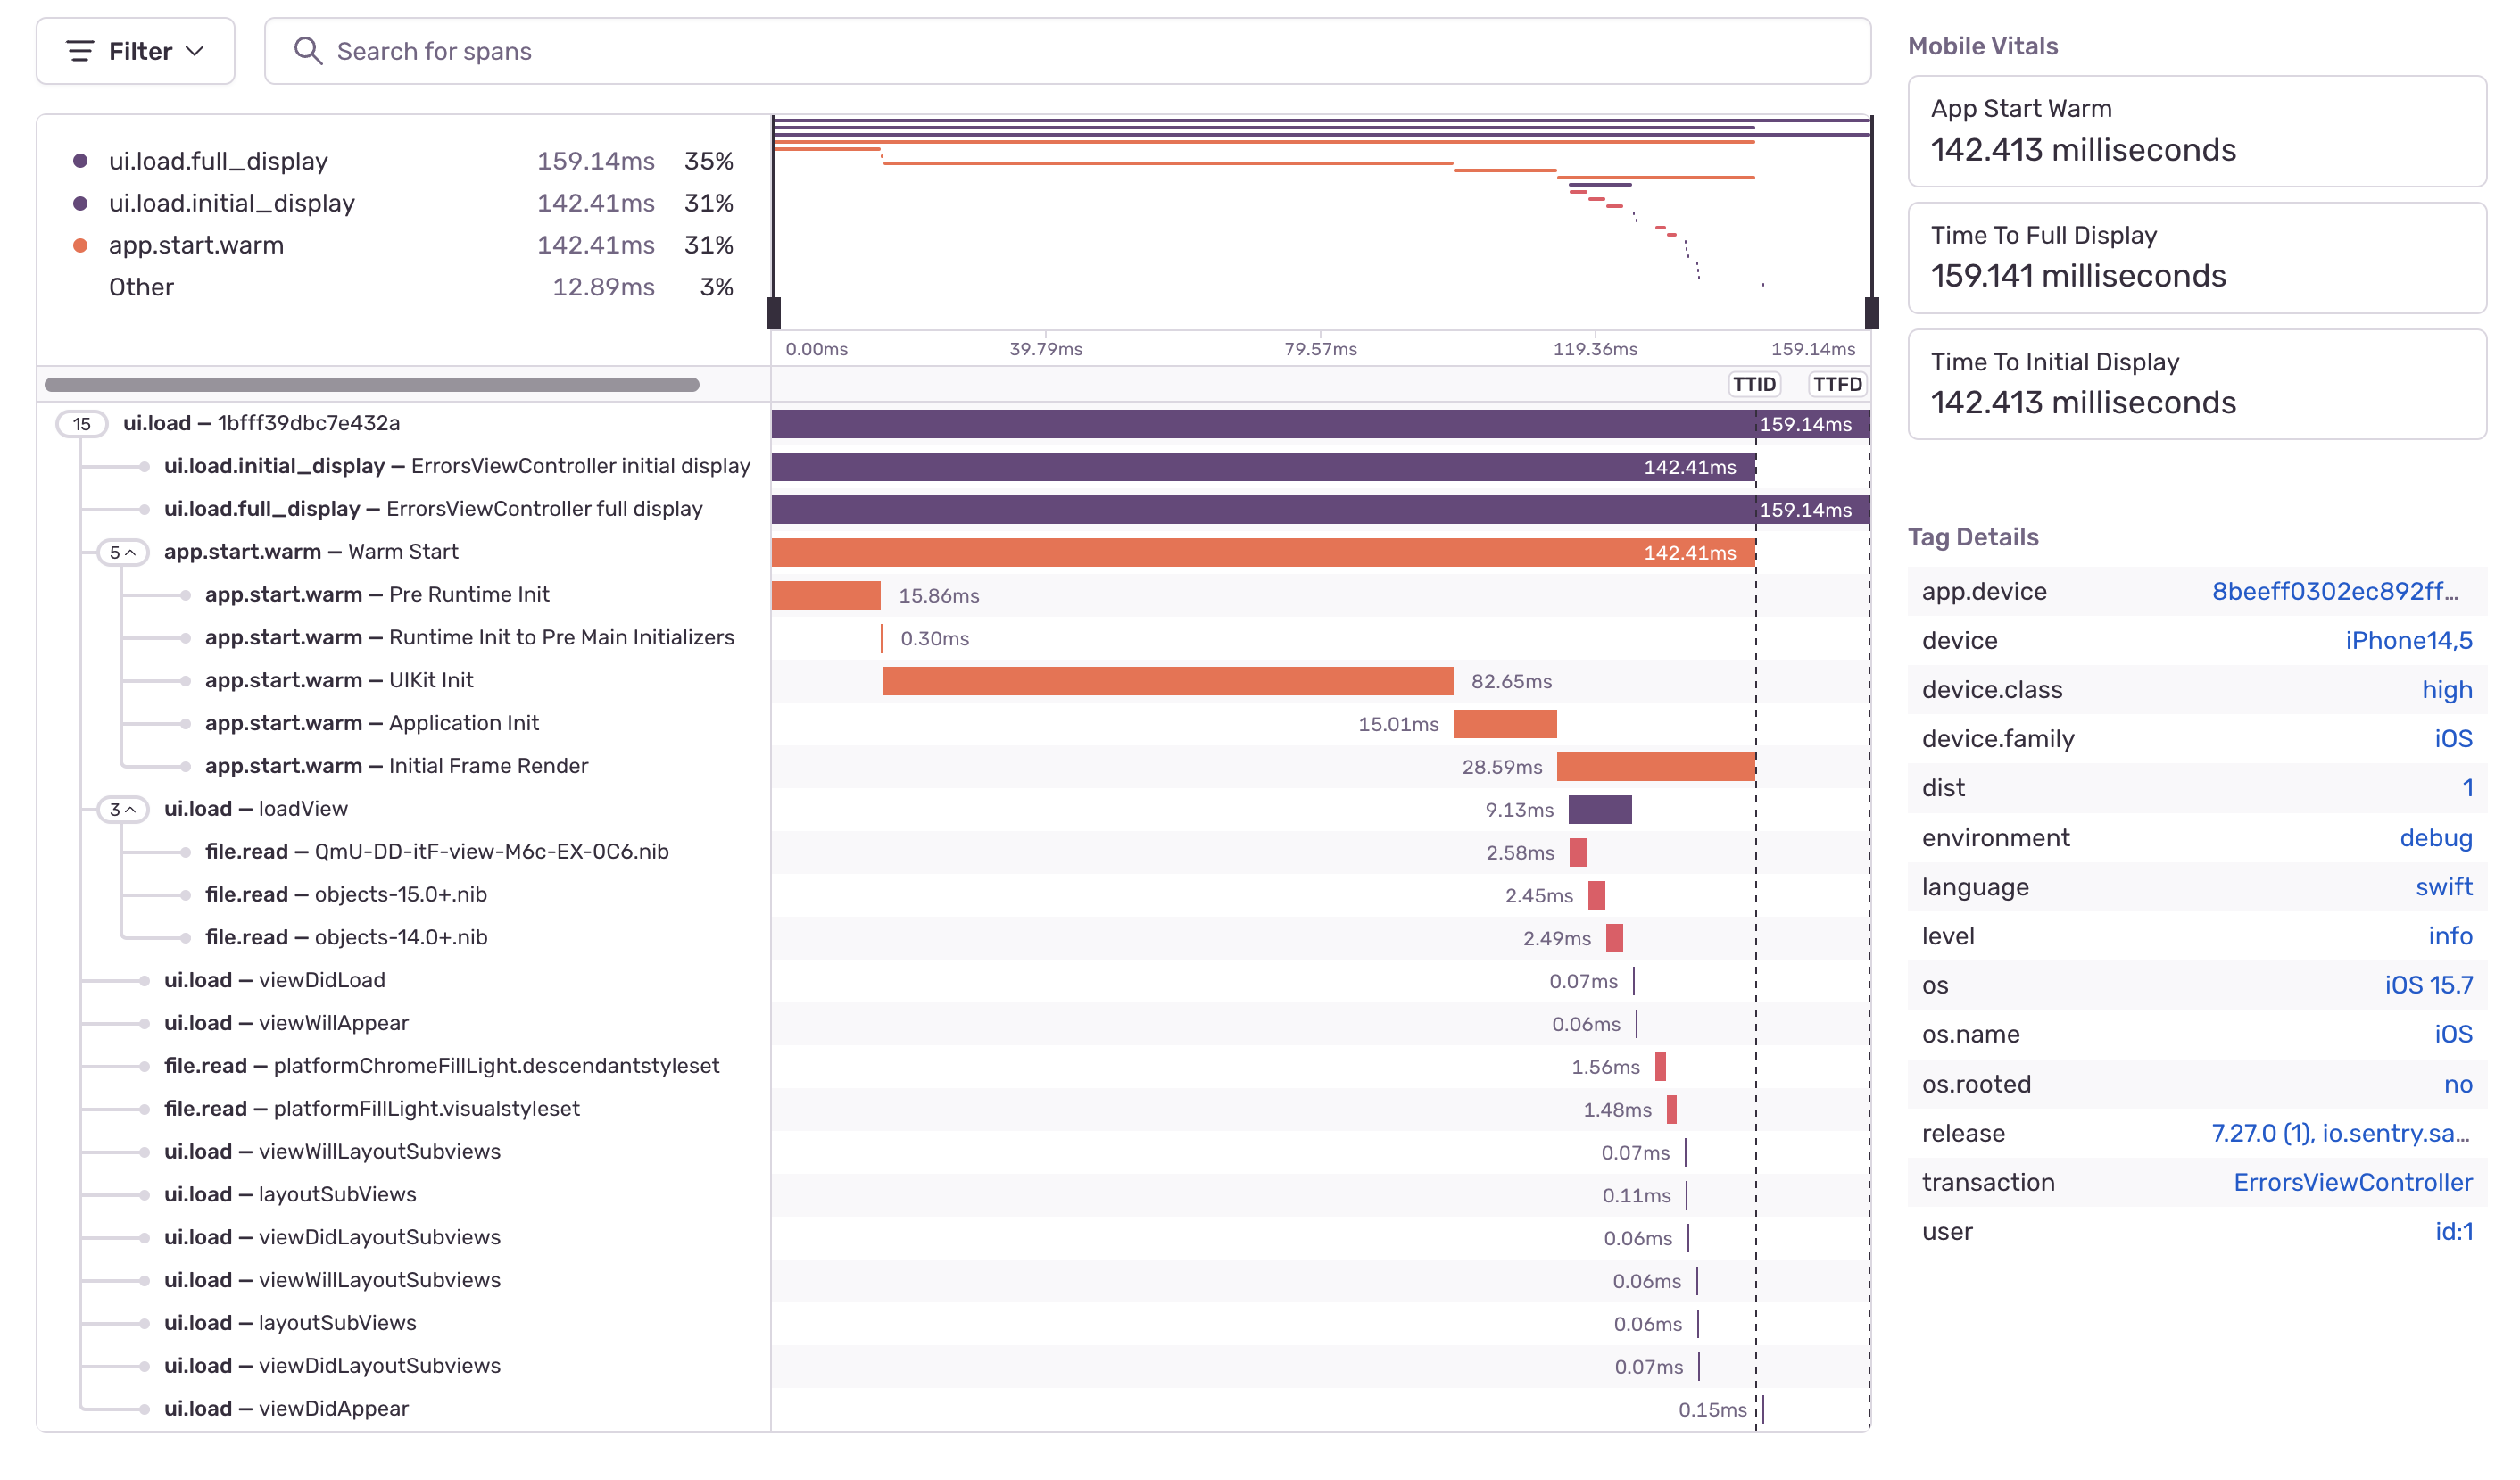
Since sentry-cocoa 8.18.0 the SDK creates the following app start spans:
- Pre Runtime Init: from the process start time to the runtime init.
- Runtime Init to Pre Main Initializers: from runtime init to pre main initializers.
- UIKit Init: from pre main initializers to the when starting the Sentry Cocoa SDK.
- Application Init: this reflects the duration of your AppDelegate
application:didFinishLaunchingWithOptionsmethod or App conformer's initializer when using SwiftUI, which is from when starting the Cocoa SDK to thedidFinishLaunchingNotification. - Initial Frame Render: from the
didFinishLaunchingNotificationtoUIWindowDidBecomeVisibleNotification. When enabling the optionenablePerformanceV2this is from thedidFinishLaunchingNotificationuntil the app renders its first frame.
Before sentry-cocoa 8.18.0 the SDK creates the following app start spans:
- Pre Runtime Init: from the process start time to the runtime init.
- Runtime Init to Pre Main Initializers: from runtime init to pre main initializers.
- UIKit and Application Init: from pre main initializers to
didFinishLaunchingNotification. - Initial Frame Render: from the
didFinishLaunchingNotificationtoUIWindowDidBecomeVisibleNotification.
Cold and warm start are Mobile Vitals, which you can learn about in the full documentation.
Starting with iOS 15, the system might prewarm your app by creating the process before the user opens it. In these cases, we won’t be able to reliably measure the app start. Enable the enablePreWarmedAppStartTracing feature to collect prewarmed app starts.
Once enabled, the SDK drops the first app start span if prewarming pauses. This approach shortens the app start duration, but it accurately represents the span of time from when a user clicks the app icon to when the app is responsive. With this feature, the SDK differentiates between four different app start types:
- Non-prewarmed cold start (See cold start definition above.)
- Non-prewarmed warm start (See warm start definition above.)
- Prewarmed cold start
- Prewarmed warm start
You can filter for different app start types in Discover with app_start_type:cold.prewarmed, app_start_type:warm.prewarmed, app_start_type:cold, and app_start_type:warm.
To enable prewarmed app start tracing:
import Sentry
SentrySDK.start { options in
options.dsn = "https://examplePublicKey@o0.ingest.sentry.io/0"
options.enablePreWarmedAppStartTracing = true
}
This feature is available for iOS, tvOS, and Mac Catalyst.
Slow and Frozen Frames are enabled by default once you set up tracing. Unresponsive UI and animation hitches annoy users and degrade the user experience. Two measurements to track these types of experiences are slow frames and frozen frames. If you want your app to run smoothly, you should try to avoid both. The SDK adds these two measurements for the transactions you capture.
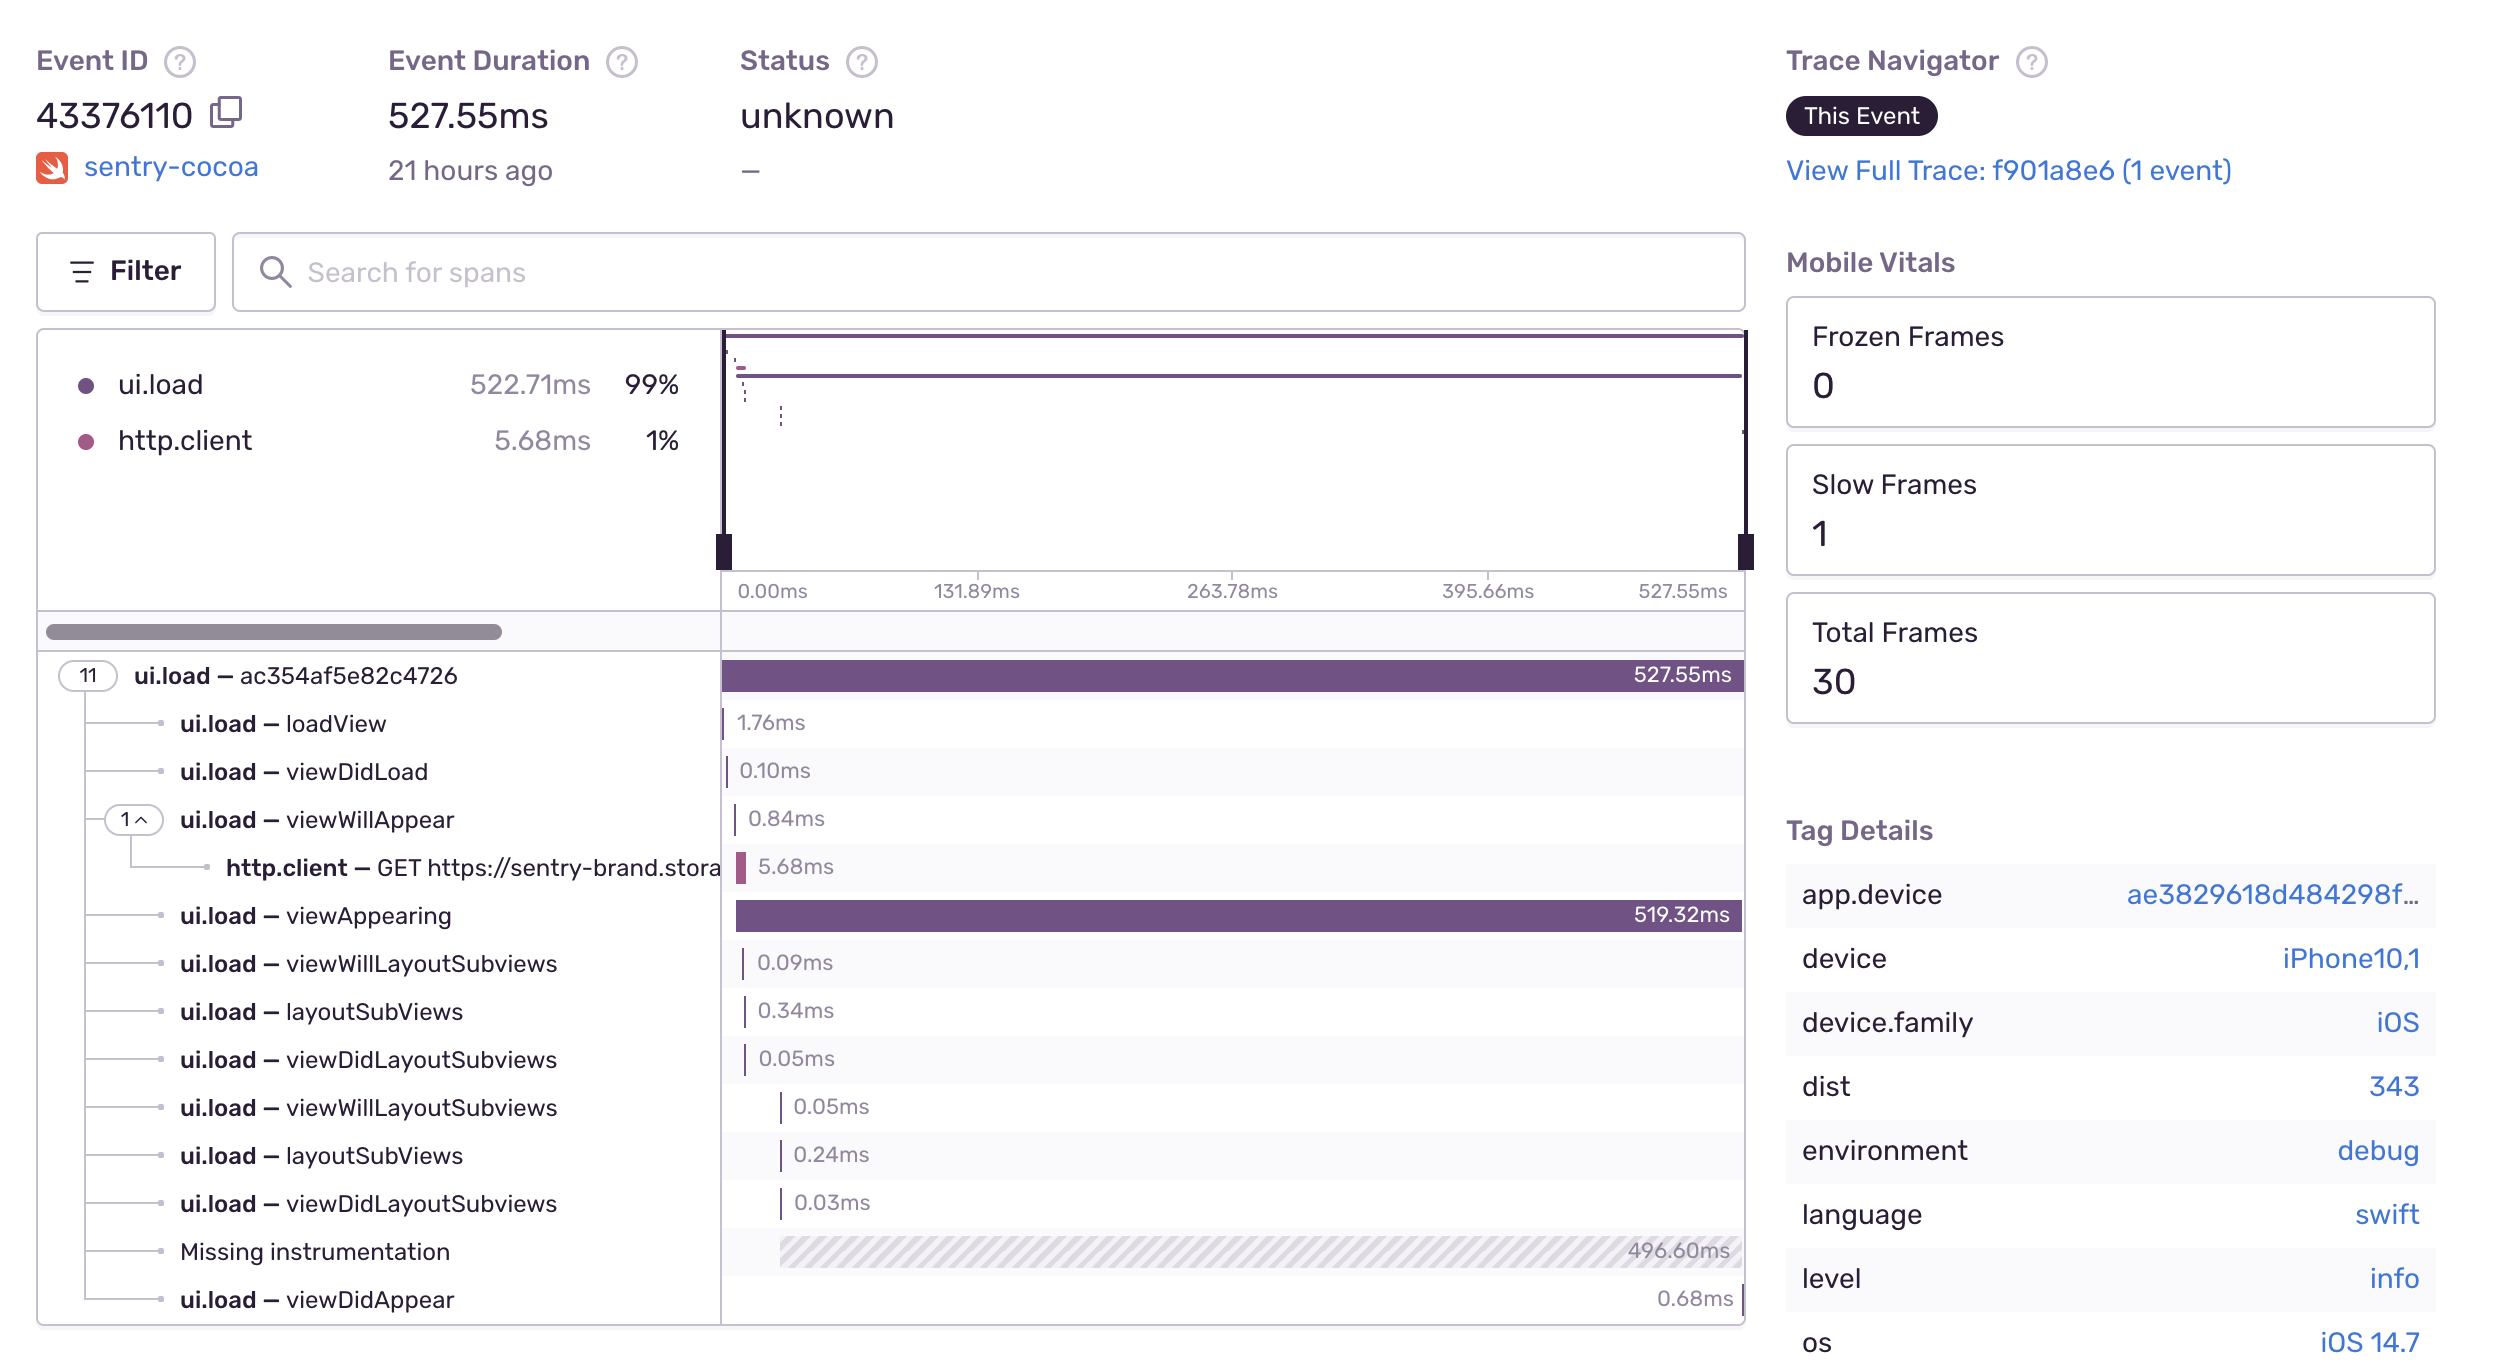
The detail view of the transaction displays the slow, frozen, and total frames:
Slow and frozen frames are Mobile Vitals, which you can learn about in the full documentation.
Network Tracking is enabled by default once you set up tracing. The Sentry SDK adds spans for outgoing HTTP requests to ongoing transactions bound to the Scope. Currently, the SDK supports requests with NSURLSession, but not the legacy NSURLConnection.
To disable the HTTP instrumentation:
import Sentry
SentrySDK.start { options in
options.dsn = "https://examplePublicKey@o0.ingest.sentry.io/0"
options.enableNetworkTracking = false
}
Sentry adds an extra header with the trace id in the outgoing HTTP requests to continue the transaction in the backend.
You can set the tracePropagationTarget option to filter which requests Sentry adds the extra header to. For example, to ensure that only your app backend will receive the trace id.
import Sentry
SentrySDK.start { options in
options.dsn = "https://examplePublicKey@o0.ingest.sentry.io/0"
options.tracePropagationTargets = ["MyAppDomain.com"]
}
The option may contain a list of NSString or NSRegularExpression against which the URLs of outgoing requests are matched. If one of the entries in the list matches the URL of an outgoing request, trace data will be attached to that request. String entries do not have to be full matches, meaning the URL of a request is matched when it contains a string provided through the option.
If tracePropagationTargets is not provided, trace data is attached to every outgoing request from the instrumented client.
The Sentry SDK adds spans for file I/O operations to ongoing transactions bound to the scope. Currently, the SDK supports operations with NSData, but many other APIs like NSFileManager, NSString and NSBundle uses NSData.
Since 8.0.0, this feature has been enabled by default to trace NSData operations. To disable it:
import Sentry
SentrySDK.start { options in
options.dsn = "https://examplePublicKey@o0.ingest.sentry.io/0"
options.enableFileIOTracing = false
// Before 8.0.0
options.enableFileIOTracking = false
}
Starting with iOS 18, macOS 15, and tvOS 18, the NSFileManager is no longer backed by NSData and needs to be swizzled directly. This feature is currently experimental and disabled by default. To use automatic file I/O tracing for NSFileManager you need to enable it:
import Sentry
SentrySDK.start { options in
options.dsn = "https://examplePublicKey@o0.ingest.sentry.io/0"
options.enableFileIOTracing = true
options.experimental.enableFileManagerSwizzling = true
}
Starting with iOS 18, tvOS 18, and macOS 15 the Swift classes Data and FileManager are no longer backed by their Objective-C counterparts NSData and NSFileManager and therefore cannot be instrumented automatically anymore. Instead, please use Manual File I/O Tracing.
Starting with version 8.48.0, the Sentry SDK offers extensions for the types Data and FileManager to track reading and writing data, as well as creating, moving, copying, and deleting files.
The method signatures of the extension resemble the ones of the original types, but they add a span to the current transaction:
Data Operations:
Data.init(contentsOfUrlWithSentryTracing:)forData(contentsOf:)data.writeWithSentryTracing(to:options:)fordata.write(to:)
// Read data from a file URL
let data = Data(contentsOfUrlWithSentryTracing: url)

// Write data to a file URL
data.writeWithSentryTracing(to: url)
FileManager Operations:
FileManager.createFileWithSentryTracing(atPath:contents:attributes:)forFileManager.createFile(atPath:contents:attributes:)FileManager.moveItemWithSentryTracing(at:to:)forFileManager.moveItem(at:to:)FileManager.moveItemWithSentryTracing(atPath:toPath:)forFileManager.moveItem(atPath:toPath:)FileManager.copyItemWithSentryTracing(at:to:)forFileManager.copyItem(at:to:)FileManager.copyItemWithSentryTracing(atPath:toPath:)forFileManager.copyItem(atPath:toPath:)FileManager.removeItemWithSentryTracing(at:)forFileManager.removeItem(at:)FileManager.removeItemWithSentryTracing(atPath:)forFileManager.removeItem(atPath:)
let fileManager = FileManager.default

// Create a file with given content
fileManager.createFileWithSentryTracing(atPath: path, contents: data)

// Move a file or directory
try fileManager.moveItemWithSentryTracing(at: sourceUrl, to: destinationUrl)
try fileManager.moveItemWithSentryTracing(atPath: sourcePath, toPath: destinationPath)

// Copy a file or directory
try fileManager.copyItemWithSentryTracing(at: sourceUrl, to: destinationUrl)
try fileManager.copyItemWithSentryTracing(atPath: sourcePath, toPath: destinationPath)

// Remove a file or directory
try fileManager.removeItemWithSentryTracing(at: url)
try fileManager.removeItemWithSentryTracing(atPath: path)
We recommend you disable the swizzling of NSData and NSFileManager when using manual file I/O tracing, as the internal behavior of these classes differs between platform versions and can cause duplicate spans in your traces.
import Sentry
SentrySDK.start { options in
options.dsn = "https://examplePublicKey@o0.ingest.sentry.io/0";
options.enableFileIOTracing = true
options.experimental.enableDataSwizzling = false
options.experimental.enableFileManagerSwizzling = false
}
The Sentry SDK adds spans for Core Data operations to ongoing transactions bound to the scope. Currently, the SDK supports fetch and save operations with NSManagedObjectContext. Since 8.0.0, this feature has been enabled by default. To disable it:
import Sentry
SentrySDK.start { options in
options.dsn = "https://examplePublicKey@o0.ingest.sentry.io/0"
options.enableCoreDataTracing = false
// Before 8.0.0
options.enableCoreDataTracking = false
}
User interaction tracing, once enabled, captures transactions for clicks. This feature is unavailable for SwiftUI. Since 8.0.0, this feature has been enabled by default. To disable it:
import Sentry
SentrySDK.start { options in
options.dsn = "https://examplePublicKey@o0.ingest.sentry.io/0"
options.enableUserInteractionTracing = false
}
The SDK composes the transaction name out of the host UIViewController and the method that the UIView is calling; for example, YourApp_LoginUIViewController.loginButton. The SDK sets the transaction operation to ui.action. If the SDK detects the interaction's origin was a click, it adds click as a suffix to the operation. The transaction finishes automatically after it reaches the specified idleTimeout and all of its child spans are finished. The idleTimeoout defaults to 3000 milliseconds (three seconds).
If the UI transaction has idled but didn't have any child spans added, the SDK will drop it.
The SDK binds user interaction transactions to the Scope automatically if there's no other transaction set. Because of that, you can create spans using custom instrumentation, and those spans will be automatically associated with the running UI transaction.
import Sentry

func loadUserDataOnClick() {
    let span = SentrySDK.span
    let innerSpan = span?.startChild(operation: "loadUserData")
    // omitted code
    innerSpan?.finish()
}
When the user interaction transaction is not finished yet, but the user makes a new interaction, or the SDK starts a new UIViewController transaction, the SDK automatically finishes the previous user interaction transaction. This is because only one transaction can be bound to the scope at a time. However, if the same view has been interacted with (for example, a UIButton was clicked again within the idleTimeout window), the idle timer will be reset and the transaction duration will be extended with the idleTimeout value.
This feature only works for UIViewControllers and not for SwiftUI.
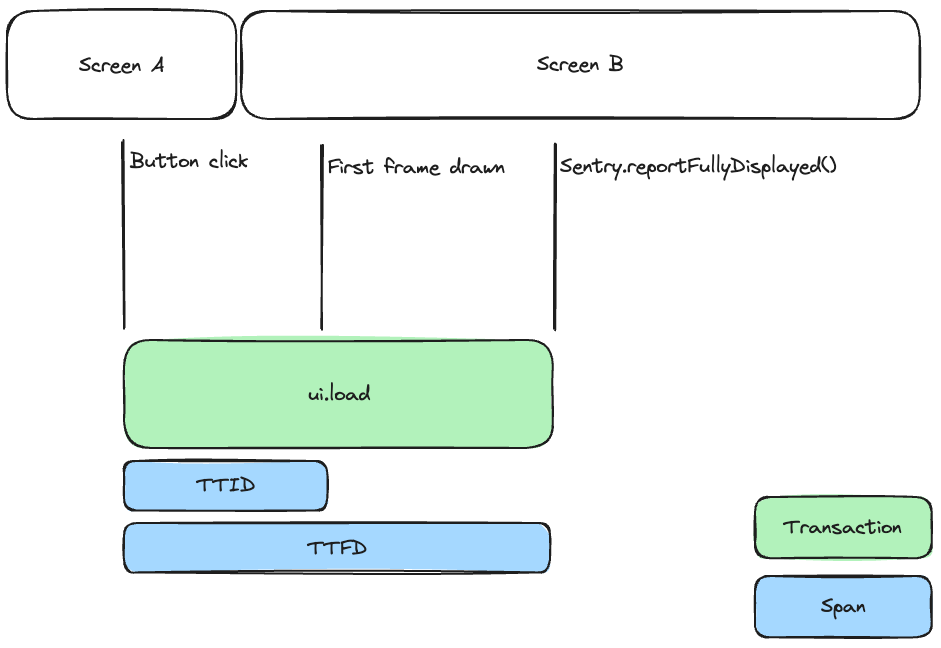
By adding a span for a view controller when it's loaded, time to initial display (TTID) provides insight into how long it takes for your view controller to launch and draw its first UI frame. The SDK sets the span operation to ui.load.initial-display and the span description to the view controller's name, followed by initial display - for example, MainViewController initial display.
The span starts when the view of a view controller is loaded, and there is no other view controller transaction happening at the moment. The span finishes after the view appeared on the screen. The following chart shows how time to initial display (TTID) and time to full display (TTFD) correlate to transitions between activities:
Since Cocoa SDK version 8.33.0, the SDK doesn't create time to initial display (TTID) and time to full display (TTFD) spans for UIViewControllers presented in the background because the logic requires UI frames to be drawn.
This feature only works for UIViewControllers and not for SwiftUI.
By adding a span for a view controller when it's loaded, time to full display (TTFD) provides insight into how long it takes your view controller to launch and load all of its content. The span starts when the view of a view controller is loaded, and there is no other view controller transaction happening at the moment. The SDK sets the span operation to ui.load.full-display and the span description to the view controllers' name, followed by full display - for example, MainActivity full display.
Since Cocoa SDK version 8.33.0, the SDK doesn't create time to initial display (TTID) and time to full display (TTFD) spans for UIViewControllers presented in the background, because the logic requires UI frames to be drawn.
Time to full display is disabled by default, but you can enable it by setting:
import Sentry
SentrySDK.start { options in
options.dsn = "https://examplePublicKey@o0.ingest.sentry.io/0"
options.enableTimeToFullDisplayTracing = true
}
We can't detect when your UIViewController is fully loaded. Only you, the user, can achieve this. Therefore, you have to manually call the API to get proper statistics. You can achieve this by using the following code:
import Sentry

SentrySDK.reportFullyDisplayed()
If the span finishes through the API, its status is set to SpanStatus.OK. If the span doesn't finish after 30 seconds, it will be finished by the SDK automatically, and its status will be set to SpanStatus.DEADLINE_EXCEEDED, also its duration will match the same of the Time to initial display span and the description will contain Deadline Exceeded suffix. If a call to reportFullyDisplayed() happens before the view controller appears, the reported time will be shifted to Time to initial display measured time.
(New in version 8.18.0), stable since 8.42.0.
We're working to update our Performance product offering in order to be able to provide better insights and highlight specific actions you can take to improve your mobile app's overall performance. The performanceV2 option changes the following behavior:
- The app start duration will now finish when the first frame is drawn instead of when the OS posts the
UIWindowDidBecomeVisibleNotification.
This change will be the default in the next major version.
You can opt out of all automatic instrumentations using the options:
import Sentry
SentrySDK.start { options in
options.dsn = "https://examplePublicKey@o0.ingest.sentry.io/0"
options.enableAutoPerformanceTracing = false
// Before 8.0.0
options.enableAutoPerformanceTracking = false
}
Our documentation is open source and available on GitHub. Your contributions are welcome, whether fixing a typo (drat!) or suggesting an update ("yeah, this would be better").