Distributed Tracing
If the overall application landscape that you want to observe with Sentry consists of more than just a single service or application, distributed tracing can add a lot of value.
In the context of tracing events across a distributed system, distributed tracing acts as a powerful debugging tool. Imagine your application as a vast network of interconnected parts. For example, your system might be spread across different servers or your application might split into different backend and frontend services, each potentially having their own technology stack.
When an error or performance issue occurs, it can be challenging to pinpoint the root cause due to the complexity of such a system. Distributed tracing helps you follow the path of an event as it travels through this intricate web, recording every step it takes. By examining these traces, you can reconstruct the sequence of events leading up to the event of interest, identify the specific components involved, and understand their interactions. This detailed visibility enables you to diagnose and resolve issues more effectively, ultimately improving the reliability and performance of your distributed system.
Here's an example showing a distributed trace in Sentry:
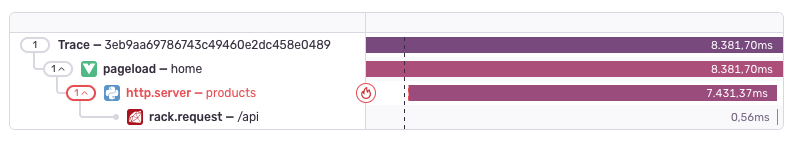
This distributed trace shows a Vue app's pageload making a request to a Python backend, which then calls the /api endpoint of a Ruby microservice.
What happens in the background is that Sentry uses reads and further propagates two HTTP headers between your applications:
sentry-tracebaggage
If you run any JavaScript applications in your distributed system, make sure that those two headers are added to your CORS allowlist and won't be blocked or stripped by your proxy servers, gateways, or firewalls.
Remix SDK attaches sentry-trace and baggage values from your root loader. You need to use the meta function to attach the data from your loader as <meta> tags. The following code snippet shows how to do this:
root.tsxexport const meta: MetaFunction = ({ data }) => {
return {
// ...
"sentry-trace": data.sentryTrace,
baggage: data.sentryBaggage,
};
};
The name attributes must be the strings "sentry-trace" and "baggage" and the content attributes must be generated by your backend Sentry SDK. For sentry-trace, use span.toSentryTrace() (or equivalent, depending on the backend platform). This guarantees that a new and unique value will be generated for each request. For baggage, use serializeBaggage(span.getBaggage()).
To get around possible Browser CORS issues, you should define tracePropagationTargets on the client side. See Dealing with CORS Issues for more information.
// entry.client.tsx
Sentry.init({
dsn: "https://examplePublicKey@o0.ingest.sentry.io/0",
integrations: [Sentry.browserTracingIntegration()],
tracePropagationTargets: ["https://myproject.org", /^\/api\//],
});
If you're using version 7.57.x or below, you'll need to have our performance monitoring feature enabled in order for distributed tracing to work.
Remember that in order to propagate trace information through your whole distributed system, you have to use Sentry in all of the involved services and applications. Take a look at the respective SDK documentation to learn how distributed tracing can be enabled for each platform.
Our documentation is open source and available on GitHub. Your contributions are welcome, whether fixing a typo (drat!) or suggesting an update ("yeah, this would be better").